
 |
 |
|
|
|
|


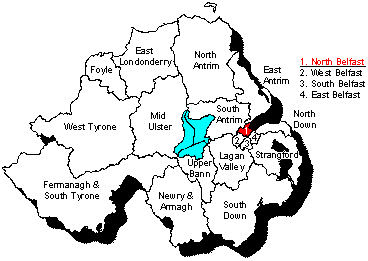
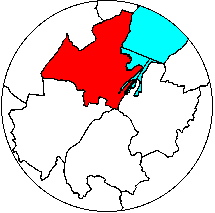
Maps by Conal Kelly and Nicholas Whyte
See also results of all North Belfast elections 1993-2010 and full counts from 2003 and 2007. Spreadsheet for 1998 here.
| |
Stage 1 | Surplus Dodds | Surplus Maginnis | Exclude Emerson, McAughtry, Doran, Blair, Quinn | ||||
| Nigel Dodds | DUP | 7476 | -1600 | 5876 | |
5876 | |
5876 |
| Alban Maginness | SDLP | 6196 | |
6196 | -320.00 | 5876 | |
5876 |
| Gerry Kelly | SF | 5610 | 0.42 | 5610.42 | 30.65 | 5641.07 | 68.7 | 5709.77 |
| Billy Hutchinson | PUP | 3751 | 81.48 | 3832.48 | 2.70 | 3835.18 | 106.45 | 3941.63 |
| Fred Cobain | UUP | 2415 | 59.22 | 2474.22 | 0.60 | 2474.82 | 33.73 | 2508.55 |
| Fraser Agnew | Ind U | 2976 | 95.34 | 3071.34 | 0.30 | 3071.64 | 30.62 | 3102.26 |
| Martin Morgan | SDLP | 2465 | 0.42 | 2465.42 | 248.05 | 2713.47 | 183.35 | 2896.82 |
| Martina McIlkenny | SF | 3165 | |
3165.00 | 6.95 | 3171.95 | 25.55 | 3197.50 |
| Eric Smyth | DUP | 1288 | 1094.10 | 2382.10 | 0.05 | 2382.15 | 28.15 | 2410.30 |
| David Browne | UUP | 2064 | 47.88 | 2111.88 | 0.55 | 2112.43 | 42.15 | 2154.58 |
| Glyn Roberts | Alliance | 1267 | 5.88 | 1272.88 | 7.95 | 1280.83 | 163.27 | 1444.10 |
| John White | UDP | 911 | 32.34 | 943.34 | 0.10 | 943.44 | 13.31 | 956.75 |
| Stephen Cooper | UKUP | 748 | 128.94 | 876.94 | |
876.94 | 22.68 | 899.62 |
| Peter Emerson | Green | 257 | 2.94 | 259.94 | 1.85 | 261.79 | -261.79 | |
| Sam McAughtry | Lab | 255 | 1.89 | 256.89 | 4.75 | 261.64 | -261.64 | |
| Steven Doran | WP | 155 | 0.84 | 155.84 | 1.80 | 157.64 | -157.64 | |
| Kevin Blair | NLP | 76 | 2.10 | 78.10 | 0.45 | 78.55 | -78.55 | |
| Dolores Quinn | Ind N | 50 | 0.42 | 50.42 | 1.00 | 51.42 | -51.42 | |
| |
|
|
|
|
|
|
|
|
| non-transferable | |
|
45.79 | 45.79 | 12.25 | 58.04 | 93.08 | 151.12 |
Stage 2: Of Dodds' 7476 votes, 5210 (69.69%) transferred to Smyth (DUP); 614 (8.21%) to Cooper (UKUP); 282 to Cobain and 228 to Browne, thus 510 (6.82%) to the UUP candidates; 454 (6.07%) to Agnew (Ind U); 388 (5.19%) to Hutchinson (PUP); 154 (2.06%) to White (UDP); 28 (0.37%) to Roberts (Alliance); 14 (0.19%) to Emerson (Green); 10 (0.13%) to Blair (NLP); 9 (0.12%) to McAughtry (Labour); 4 (0.05%) to Doran (WP); 2 to Kelly and none to McIlkenny, thus 2 (0.03%) to the SF candidates; 2 also to Morgan (SDLP); and 2 also to Quinn (Ind Nat) with 75 (1.00%) non-transferable.
Stage 3: Of Maginnis' 6196 votes, 4961 (80.07%) transferred to Morgan (SDLP); 613 to Kelly and 139 to McIlkenny, thus 752 (12.14%) to SF; 159 to Roberts (Alliance); 95 (1.53%) to McAughtry (Labour); 54 (0.87%) to Hutchinson (PUP); 37 (0.60%) to Emerson (Green); 36 (0.58%) to Doran (WP); 12 to Cobain and 11 to Browne, thus 23 (0.37%) to the UUP; 20 (0.32%) to Quinn (Ind Nat); 9 (0.15%) to Blair (NLP); 6 (0.10%) to Agnew (Ind U); 2 (0.03%) to White (UDP); and 1 (0.02%) to Smyth (DUP) with 41 (0.66%) non-transferable.
| |
Stage 4 | Exclude Cooper | Exclude White | Exclude Roberts | ||||
| Nigel Dodds | DUP | 5876 | |
5876 | |
5876 | |
5876 |
| Alban Maginness | SDLP | 5876 | |
5876 | |
5876 | |
5876 |
| Gerry Kelly | SF | 5709.77 | |
5709.77 | |
5709.77 | 9.65 | 5719.42 |
| Billy Hutchinson | PUP | 3941.63 | 71.19 | 4012.82 | 386.92 | 4399.74 | 239.26 | 4639.00 |
| Fred Cobain | UUP | 2508.55 | 73.97 | 2582.52 | 108.83 | 2691.35 | 171.25 | 2862.60 |
| Fraser Agnew | Ind U | 3102.26 | 186.25 | 3288.51 | 82.04 | 3370.55 | 158.46 | 3529.01 |
| Martin Morgan | SDLP | 2896.82 | 1.21 | 2898.03 | 2.05 | 2900.08 | 416.40 | 3316.48 |
| Martina McIlkenny | SF | 3197.50 | |
3197.50 | |
3197.50 | 11.45 | 3208.95 |
| Eric Smyth | DUP | 2410.30 | 442.20 | 2852.50 | 200.50 | 3053 | 28.89 | 3081.89 |
| David Browne | UUP | 2154.58 | 42.46 | 2197.04 | 85.73 | 2282.77 | 268.82 | 2551.59 |
| Glyn Roberts | APNI | 1444.10 | 12.26 | 1456.36 | 17.00 | 1473.36 | -1473.36 | |
| John White | UDP | 956.75 | 17.68 | 974.43 | -974.43 | |
|
|
| Stephen Cooper | UKUP | 899.62 | -899.62 | |
|
|
|
|
| |
|
|
|
|
|
|
|
|
| non-transferable | |
151.12 | 52.40 | 203.52 | 91.36 | 294.88 | 169.18 | 464.06 |
| |
Stage 7 | Exclude Browne | Exclude Smyth | Exclude McIlkenny | ||||
| Nigel Dodds | DUP | 5876 | |
5876 | |
5876 | |
5876 |
| Alban Maginness | SDLP | 5876 | |
5876 | |
5876 | |
5876 |
| Gerry Kelly | SF | 5719.42 | 5.10 | 5724.52 | 6.21 | 5730.73 | 3062.00 | 8792.73 |
| Billy Hutchinson | PUP | 4639.00 | 289.33 | 4928.33 | 537.10 | 5465.43 | 12.45 | 5477.88 |
| Fred Cobain | UUP | 2862.60 | 1671.44 | 4534.04 | 576.89 | 5110.93 | 0.05 | 5110.98 |
| Fraser Agnew | Ind U | 3529.01 | 318.07 | 3847.08 | 1117.13 | 4964.21 | 1.10 | 4965.31 |
| Martin Morgan | SDLP | 3316.48 | 23.45 | 3339.93 | 12.26 | 3352.19 | 87.6 | 3439.79 |
| Martina McIlkenny | SF | 3208.95 | 1.00 | 3209.95 | 0.21 | 3210.16 | -3210.16 | |
| Eric Smyth | DUP | 3081.89 | 103.33 | 3185.22 | -3185.22 | |
|
|
| David Browne | UUP | 2551.59 | -2551.59 | |
|
|
|
|
| |
|
|
|
|
|
|
|
|
| non-transferable | |
464.06 | 139.87 | 603.93 | 935.42 | 1539.35 | 46.96 | 1586.31 |
| |
Stage 10 | Surplus Kelly | |
||
| Nigel Dodds | DUP | 5876 | |
5876 | |
| Alban Maginness | SDLP | 5876 | |
5876 | |
| Gerry Kelly | SF | 8792.73 | -2916.73 | 5876 | |
| Billy Hutchinson | PUP | 5477.88 | 39.00 | 5516.88 | |
| Fred Cobain | UUP | 5110.98 | 3.00 | 5113.98 | |
| Fraser Agnew | Ind U | 4965.31 | 6.00 | 4971.31 | |
| Martin Morgan | SDLP | 3439.79 | 1242.00 | 4681.79 | |
| |
|
|
|
|
|
| non-transferable | |
1586.31 | 1626.73 | 3213.04 | |
Stage 11: Of the 3062 votes transferred to Kelly from McIlkenny, 1242 (40.56%) went to Morgan (SDLP), 39 (1.27%) to Hutchinson (PUP), 6 (1.96%) to Agnew (Ind U) and 3 (0.98%) to Cobain (UUP) with 1772 (57.87%) non-transferable.
Full 1998 results for each seat: East Belfast | North Belfast | South Belfast | West Belfast | East Antrim | North Antrim | South Antrim | North Down | South Down | Fermanagh and South Tyrone | Foyle | Lagan Valley | East Londonderry | Mid Ulster | Newry and Armagh | Strangford | West Tyrone | Upper Bann
Other sites based at ARK: ORB (Online Research Bank) | CAIN (Conflict Archive on the INternet) | Northern Ireland Life and Times Survey
Your comments, please! Send an email to me at nicholas.whyte@gmail.com..
Nicholas Whyte, 15 October 2000; modified 16 February 2002.
|
|
Disclaimer:©
Nicholas Whyte 1998-2004 Last Updated onSaturday,
20-Mar-2010 20:03
|