

| |
|
|
|
|
|
|
 |
| Map and graph by Conal Kelly | |
This constituency takes in the west and centre of Causeway Coast and Glens District Council,
and a small part of Derry and Strabane
District Council. In 2001 the DUP's Gregory Campbell
defeated William Ross (UUP), who had represented East Londonderry
since it was formed in 1983. The DUP hold two Assembly seats here,
and the SDLP and Sinn Fein one each with the last held
successively by independent Claire Sugden. See the 1983-92 East Londonderry results.
2019 Westminster notional result on new boundaries:
DUP 16,456 (40.0%)
SDLP 6,749 (16.4%)
SF 6,343 (15.4%)
Alliance 5,970 (14.5%)
UUP 3,756 (9.1%)
Aontu 1,776 (4.3%)
PBP 51 (0.1%)
| DUP | UUP | Alliance | PBP | SDLP | SF | Aontu | ||
| 2019 actual |
15,765 | 3,599 | 5,921 | 6,158 | 6,128 | 1,731 | ||
| 40.1% | 9.2% | 15.1% | 15.7% | 15.6% | 4.4% | |||
| From East Londonderry |
To East Londonderry | 15,765 | 3,599 | 5,921 | 6,158 | 6,128 | 1,731 | |
| From Foyle |
To East Londonderry | 691 | 157 | 49 | 51 | 591 | 215 | 45 |
| 2019 notional |
16,456 | 3,756 | 5,970 | 51 | 6,749 | 6,343 | 1,776 | |
| 40.0% | 9.1% | 14.5% | 0.1% | 16.4% | 15.4% | 4.3% | ||
| -0.1% | - |
-0.5% | +0.1% | +0.8% | -0.2% | -0.1% |
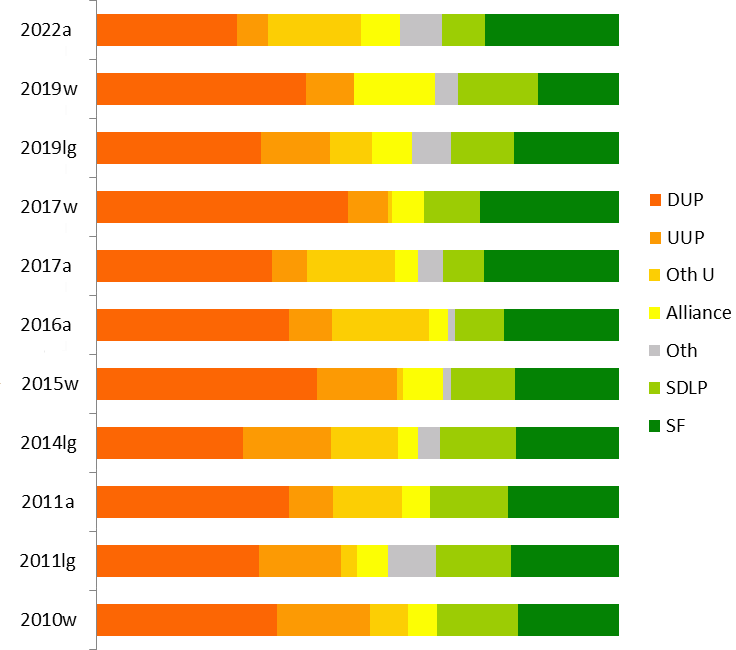
| DUP | UUP | Oth U | Alliance | Oth | SDLP | SF | |
| 2024w |
27.9% |
8.3% |
11.1% |
9.1% |
3.6% |
12.7% |
27.4% |
| 2022a |
26.9% | 5.9% | 17.7% | 7.5% | 8.0% | 8.3% | 25.6% |
| 2019w | 40.1% | 9.2% | 15.1% | 4.4% | 15.7% | 15.6% | |
| 2019lg |
31.4% | 13.3% | 8.3% | 7.7% | 7.2% | 12.0% | 20.2% |
| 2017w | 48.1% | 7.6% | 0.8% | 6.2% | 10.8% | 26.5% | |
| 2017a |
34.0% | 7.0% | 17.6% | 4.4% | 4.9% | 7.9% | 26.0% |
| 2016a |
36.8% | 8.3% | 18.5% | 3.7% | 1.5% | 9.5% | 21.8% |
| 2015w |
42.2% | 15.4% | 1.2% | 7.6% | 1.5% | 12.3% | 19.8% |
| 2014lg |
28.2% | 16.8% | 12.8% | 3.8% | 4.2% | 14.6% | 19.6% |
| 2011a | 36.9% | 8.4% | 13.1% | 5.5% | 14.9% | 21.1% | |
| 2011lg |
31.2% | 15.6% | 3.1% | 6.0% | 9.2% | 14.2% | 20.7% |
| 2010w | 34.6% | 17.8% | 7.4% | 5.5% | 15.5% | 19.3% | |
| 2007a |
38.4% | 17.5% | 1.5% | 3.8% | 3.2% | 14.8% | 20.8% |
| 2005w | 41.0% | 19.7% | 2.4% | 0.2% | 19.3% | 17.4% | |
| 2005lg | 31.3% | 23.2% | 3.5% | 2.7% | 3.7% | 18.4% | 17.1% |
NB that the figures for elections before 2010 are projections.
| @Caoimhe Archibald (SF) 6,868 (15.5%) @Maurice Bradley (DUP) 6,786 (15.3%) Alan Robinson (DUP) 5,151 (11.6%) Kathleen McGurk (SF) 4,500 (10.1%) @Claire Sugden (Ind U) 3,981 (9.0%) @Cara Hunter (SDLP) 3,664 (8.3%) Chris McCaw (Alliance) 3,338 (7.5%) Jordan Armstrong (TUV) 2,959 (6.7%) Darryl Wilson (UUP) 2,625 (5.9%) Stephanie Quigley (Ind) 1,503 (3.4%) Gemma Brolly (Aontú) 1,095 (2.5%) Russell Watton (PUP) 933 (2.1%) Mark Coulson (Green) 347 (0.8%) Amy Merron (PBP) 347 (0.8%) Niall Murphy (Ind) 181 (0.4%) Billy Stewart (Ind) 82 (0.2%) @ member of the Assembly when it was dissolved. |
DUP 11,937 (26.9%, -7.1%) 2 seats SF 11,368 (25.6%, -0.4%) 1 seat Ind U 3,981 (9.0%, -3.0%) 1 seat SDLP 3,664 (8.3%, +0.4%) 1 seat Alliance 3,338 (7.5%, +3.1%) TUV 2,959 (6.7%, +3.7%) UUP 2,625 (5.9%, -1.1%) Ind 1,766 (4.0%) Aontú 1,095 (2.5%) PUP 933 (2.1%, ±0%) Green 347 (0.8%, +0.1%) PBP 347 (0.8%, -0.4%) Electorate: 72,959 Votes cast: 44,796 (61.4%, -1.3%), spoilt votes 436 (1.0%) Valid votes: 44,360, quota 7,394 |
*Gregory Campbell (DUP) 15,765 (40.1%, -8.0%)
Cara Hunter (SDLP) 6,158 (15.7%, +4.9%)
Dermot Nicholl (SF) 6,128 (15.6%, -10.9%)
Chris McCaw (Alliance) 5,921 (15.1%, +8.9%)
Richard Holmes (UUP) 3,599 (9.2%, +1.5%)
Sean McNicholl (Aontú) 1,731 (4.4%, +4.4%)
* outgoing MP.
Electorate: 69,246; Total Poll: 39,495 (57.0%); Invalid Votes:
193 (0.5%); Valid Votes: 39,302
Campbell successfully returned for the sixth time. A three-way
jostling for second place, with SDLP, SF and Alliance within 240
votes of each other. DUP lost votes mostly to Alliance, with SF
defectors splitting fairly evenly between SDLP and Aontu. This was
Aontu's best result of the election. In a five-seat Assembly
election, these votes would give the DUP two seats and one each
for SF, SDLP and Alliance.
From the 2011 census, East Londonderry includes:
The entire Causeway Coast and Glens DEA of Bann
*Gregory Campbell (DUP) 19,723 (48.1%, +5.9%)
Dermot Nicholl (SF) 10,881 (26.5%, +6.7%)
Stephanie Quigley (SDLP) 4,423 (10.8%, -1.5%)
Richard Holmes (UUP) 3,135 (7.6%, -7.8%)
Chris McCaw (Alliance) 2,538 (6.2%, -1.4%)
Liz St Claire-Legge (Cons) 330 (0.8%, -0.4%)
* outgoing MP.
@ member of the Assembly
Electorate: 67,038; Total Poll: 41,278 (61.6%); Invalid Votes:
124 (0.3%); Valid Votes: 41,154
A good result for the DUP. In a five-seat Assembly election, this
would deliver three DUP MLAs and probably two SF, though the
second seat would require both good balancing and SDLP transfers,
and a fourth Unionist (or if they were very lucky, Alliance) might
also be possible.
| @Caoimhe Archibald (SF) 5,851 (14%) @Maurice Bradley (DUP) 5,444 (13%) @Claire Sugden (Ind U) 4,918 (11.7%) @George Robinson (DUP) 4,715 (11.3%) Cathal Ó hOisín (SF) 4,953 (11.8%) @Adrian McQuillan (DUP) 3,881 (9.3%) John Dallat (SDLP) 3,319 (7.9%) William McCandless (UUP) 2,814 (6.7%) Chris McCaw (Alliance) 1,841 (4.4%) @Gerry Mullan (Ind) 1,204 (2.9%) Jordan Armstrong (TUV) 1,038 (2.5%) Russell Watton (PUP) 879 (2.1%) Gavin Campbell (PBP) 492 (1.2%) Anthony Flynn (Green)305 (0.7%) David Harding (Conservative)219 (0.5%) |
DUP 14,040 (34.0%, -2.8%) 2 seats (-1) Sinn Féin 10,804 (26.0%, +4.2%) 1 seat Independent Unionist 4,918 (12.0%, +2.3%) 1 seat SDLP 3319 (7.9%, -1.6%) 1 seat UUP 2,814 (7.0%, -1.3%) Alliance 1,841 (4.4%, +0.7%) Independent Nationalist 1,204 (3.0%) TUV 1,038 (3.0%, -0.5%) PUP 879 (2.1%, -1.8%) PBP 492 (1.2%) Green 305 (0.7%, -0.6%) Conservative 219 (0.5%, -0.3%) Electorate: 67,392 Votes cast: 42,248 (62.7%). spoilt votes: 375 (0.9%) Valid votes: 41,873, quota: 6,979 |
| @Maurice Bradley (DUP) 4,630 @George Robinson (DUP) 4,567 Caoimhe Archibald (SF) 4,002 @Cathal Ó hOisín (SF) 3,493 @Adrian McQuillan (DUP) 3,477 @Claire Sugden (Independent) 3,270 Gerry Mullan (SDLP) 3,265 William McCandless (UUP) 1,789 Russell Watton (PUP) 1,356 Yvonne Boyle (APNI) 1,257 Jordan Armstrong (TUV) 1,191 Aaron Callan (UUP) 1,067 Amber Hammill (Green) 434 Steven Parkhill (UKIP) 274 David Harding (Conservative) 216 Tor Christie (Independent) 61 Stuart Canning (Conservative) 50 |
DUP 12,674 (36.8%, -0.1%) 3 seats SF 7,495 (21.8%, +0.7%) 1 seat Independents 3,331 (9.7%, +1.2%) 1 seat SDLP 3,265 (9.5%, -5.4%) 1 seat UUP 2,856 (8.3%, -0.1%) PUP 1,356 (3.9%) Alliance 1,257 (3.7%, -1.8%) TUV 1,191 (3.5%, -1.0%) Green 434 (1.3%) UKIP 274 (0.8%) Conservative 266 (0.8%) Electorate: 68,600 Votes cast: 34,848 (50.8%), spoilt votes: 449 (1.3%) Valid votes: 34,399, quota: 4,915 |
An interesting result where incumbent Cathal Ó hOisín (SF)
started in fourth place, but was overtaken by three other
candidates and eventually lost out to running mate Caoimhe
Archibald by 606.32 votes. Crucial transfers to the SDLP came from
Alliance and, interestingly, also from the UUP.
*Gregory Campbell (DUP) 14,663 (42.2%, +7.6%)
Caoimhe Archibald (SF) 6,859 (19.8%, +0.5%)
William McCandless (UUP) 5,333 (15.4%, -2.4%)
Gerry Mullan (SDLP) 4,268 (12.3%, -3.2%)
Yvonne Boyle (Alliance) 2,642 (7.6%, +2.1%)
Neil Paine (Cannabis Is Safer Than Alcohol) 527 (1.5%)
Elizabeth St Clair-Legge (Conservative) 422 (1.2%)
Electorate: 66,926; Total Poll: 34,965 (52.2%); Invalid Votes: 251
(0.7%); Valid Votes: 34,714
A good result for Campbell, the only seat where the DUP managed a
significant increas in vote share without a pact; he appears to
have absorbed the votes cast for his predecessor standing as TUV
last time.
If cast in a six-seat Assembly election, these votes would gove
the DUP three seats and SF, the UUP and the SDLP one each.
From the 2011 census, East Londonderry includes:
The entire Causeway Coast and Glens DEA of Bann
|
@Gregory Campbell MP (DUP) 6,319 (18.2%) @ member of the Assembly when it was dissolved. |
DUP 12,807 (36.9%, -2.9%) 3 seats SF 7,320 (21.1%, +1.0%) 1 seat SDLP 5,189 (14.9%, +1.9%) 1 seat McClarty 3,003 (8.6%) 1 seat (+1) UUP 2,930 (8.4%, -10.0%) (-1) Alliance 1,905 (5.5%, +1.4%) TUV 1,568 (4.5%) Electorate: 65,226 Votes cast: 35,303 (54.12%), spoilt votes: 581 (1.6%) Valid votes: 34,722, quota: 4,961 |
The UUP's deselection of sitting MLA
David McClarty proved a serious mistake, as he stood and won his
seat back as an independent, his former party losing out entirely
in a seat that they held at Westminster until ten years
previously. The DUP's Adrian McQuillan took the last seat by 320
votes ahead of the UUP's David Harding, with an SDLP surplus of
246 undistributed (which would probably have made little
difference).
*@Gregory Campbell (DUP) 12,097 (34.6%,
-6.4%)
Cathal Ó hOisín (Sinn Féin) 6,742 (19.3%, +1.9%)
Lesley Macaulay (UCUNF) 6,218 (17.8%, -1.9%)
Thomas Conway (SDLP) 5,399 (15.5% -3.8%)
William Ross (TUV) 2,572 (7.4%)
Barney Fitzpatrick (Alliance) 1,922 (5.5%, +3.1%)
Electorate: 63,220; Total Poll: 35,086 (55.5%); Invalid Votes: 136
(0.4%); Valid Votes: 34,950
The DUP suffered minor erosion here, but as in so many other places, TUV simply failed to break in, even though their candidate had represented this area at Westminster for 27 years. In a six-seat Assembly election, these votes would make the DUP's third seat vulnerable to either TUV or Alliance.
| *Gregory Campbell MP
(DUP) 6845 (20.2%) *Francie Brolly (SF) 4476 (13.2%) *George Robinson (DUP) 3991 (11.8%) *David McClarty (UUP) 2875 (8.5%) Adrian McQuillan (DUP) 2650 (7.8%) *John Dallat (SDLP) 2638 (7.8%) Billy Leonard (SF) 2321 (6.8%) *Norman Hillis (UUP) 2054 (6.1%) Orla Beattie (SDLP) 1797 (5.3%) Barney Fitzpatrick (Alliance) 1401 (4.1%) Edwin Stevenson (UUP) 1338 (3.9%) Joseph Cubitt (UKUP) 549 (1.6%) Philippe Moison (Green) 521 (1.5%) Michael McGonigle (RSF) 393 (1.2%) Victor Christie 73 (0.2%) *Elected in 2003 from East Londonderry |
DUP 13,486 (39.8%, +7.4%) 3 seats (+1) SF 6,797 (20.0%, +2.2%) 1 seat UUP 6,267 (18.5%, -4.2%) 1 seat (-1) SDLP 4,435 (13.1%, -3.2%) 1 seat Alliance 1,401 (4.1%, +1.9%) UKUP 549 (1.6%, -1.0%) Green 521 (1.5%) RSF 393 (1.2%) Independent 73 (0.2%) Electorate 56,104 Votes cast 34,180 (60.9%); spoilt votes 258 (0.8%) Valid votes 33,922; quota 4,847 |
*@Gregory Campbell (DUP) 15,225 (42.9% +10.8%)
@David McClarty (UUP) 7,498 (21.1% -6.3%)
@John Dallat (SDLP) 6,077 (17.1% -3.7%)
Billy Leonard (Sinn Fein) 5,709 (16.1% +0.5%)
Yvonne Boyle (Alliance) 924 (2.6% -1.5%)
Malcolm Samuel (Independent) 71 (0.2% +0.2%)
* outgoing MP.
@ Member of the Assembly
Not a surprise. These votes, if cast in a six-seat STV election, would probably have given the DUP three seats and the UUP, Sinn Fein and SDLP one each.
First preference votes cast in the whole of the Coleraine and Limavady council areas were as follows:
DUP 11295 (32.1%)
UUP 8573 (24.3%)
Sinn Fein 5864 (16.6%)
SDLP 5764 (16.4%)
United Unionist Coalition 1328 (3.8%) Best equivalent result
in Northern Ireland
Alliance 1026 (2.9%)
Independents 1388 (3.9%)
It is easy enough to extrapolate from the local council elections because the East Londonderry constituency includes two whole district councils. On these votes the DUP would win two seats, the UUP probably also two, and Sinn Fein and the SDLP one each.
| *Gregory Campbell (DUP) 4789 (14.0%) *David McClarty (UUP) 4069 (11.9%) Francis Brolly (SF) 4019 (11.7%) George Robinson (DUP) 3466 (10.1%) *John Dallat (SDLP) 3190 (9.3%) Maurice Bradley (DUP) 2836 (8.3%) *Michael Coyle (SDLP) 2394 (7.0%) Norman Hillis (UUP) 2292 (6.7%) Cliona O'Kane (SF) 2102 (6.1%) *Boyd Douglas (UUC) 1903 (5.6%) Edwin Stevenson (UUP) 1408 (4.1%) *Pauline Armitage (Ind) 906 (2.6%) Yvonne Boyle (Alliance) 762 (2.2%) Marion Baur (SEA) 137 (0.4%) |
DUP 11,091 (32.4%, +8.7%) 2 seats UUP 7,769 (22.7%, -2.5%) 2 seats SF 6,121 (17.9%, 8.1%) 1 seats SDLP 5,584 (16.3%, -7.4%) 1 seat UUC 1,903 (5.6%) Best result for UUC in Northern Ireland UKUP 906 (2.6%) Alliance 762 (2.2%, -3.9%) SEA 137 (0.4%) Electorate 56,203 |
Reaction: As widely predicted, sitting MLA's Pauline
Armitage, Boyd Douglas and Michael Coyle lost their seats; the DUP
and SF gained. Better balancing by the DUP could conceivably have
got them a third seat ahead of the UUP's Hillis; better balancing
by the UUP would of course have reduced any such threat. The final
margin was Dallat's 218 votes ahead of his running-mate Coyle; two
counts earlier, Coyle had edged out the DUP's Bradley by 153 votes
but in fact this was only for the honour of being runner-up.
East Londonderry had lost 9.12% of its electorate in the great
electoral
register shake-out, varying from 15.16% in the Cross Glebe
ward of Coleraine to 4.99% in Ringsend, also in Coleraine. 5
constituencies lost fewer voters, 12 lost more.
Electorate: 60,215; votes cast: 40,268 (66.8%), spoilt votes: 399
(0.9%);
Valid votes: 39,869; DUP majority 1,901
* outgoing MP
@ member of the Assembly
UUP 11157 (28%)
DUP 9459 (24%)
SDLP 9216 (23%)
SF 3784 (10%)
Alliance 1579 (4%)
UUAP 1351 (3%) Best equivalent result in Northern Ireland
PUP 146 (0.4%)
Independents 3019 (8%)
Total valid votes 39711
If these votes had been cast in a six-seat STV election, the UUP and DUP would have won two seats each, and the SDLP one. Sinn Fein would be the most likely to pick up the last seat.
| #Gregory Campbell (DUP) 6,099 David McClarty (UUP) 5,108 John Dallat (SDLP) 4,760 *Arthur Doherty (SDLP) 4,606 Boyd Douglas (Unionist) 3,811 Pauline Armitage (UUP) 3,315 elected 9th count George Robinson (DUP) 3,208 Malachy O'Kane (SF) 2,521 Barbara Dempsey (Alliance) 2,395 Robert McPherson (UUP) 1,531 John McIlhenny (SF) 1,339 David Gilmour (PUP) 582 David Nelson (UDP) 171 Maura McCann (NLP) 46 |
UUP 9,954 (25.21%) 2 seats
SDLP 9,366 (23.72%) 2 seats DUP 9,307 (23.57%) 1 seat SF 3,860 (9.77%) Unionist 3,811 (9.65%) 1 seat Alliance 2,395 (6.06%) PUP 582 (1.47%) UDP 171 (0.43%) NLP 46 (0.12%) Electorate: 59,370 |
* elected in 1996 Forum/talks election from East Londonderry
# elected in 1996 Forum/talks election as a 'top-up' candidate
Boyd Douglas, an independent Unionist opposed to the Agreement, performed well enough to take one of the Unionist seats with transfers from other Unionists. Good vote management by the SDLP ensured that they stayed ahead of SF to win the other two. The order of the candidates did not change much during the count and the DUP were the runners-up, George Robinson finishing with 3,867 votes to Boyd Douglas's 4,260.
Ulster Unionist Party 13,598 votes (35%)
Social Democratic and Labour Party 9,565 votes (25%)
Democratic Unionist Party 7,218 votes (18%)
Sinn Féin 3,373 votes (9%)
Alliance Party of Northern Ireland 1,738 votes (5%)
Women's Coalition 146 votes (0.38%)
Workers Party 53 votes (0.14%)
Others 1,689 votes (4%)
Total valid votes 38,436 (57.38% of electorate)
Ulster Unionist Party (UUP) 11,386 (31%); David Brewster, Robert
White elected
Democratic Unionist Party (DUP) 8,768 (24%); Robert Bolton, Robert
Stewart elected
Social Democratic and Labour Party (SDLP) 7,451 (20%); Arthur
Doherty elected
Sinn Féin (SF) 3,413 (9%)
Alliance Party of Northern Ireland (APNI) 2,107 (6%)
United Kingdom Unionist Party (UKUP) 1,040 (3%)
Ulster Democratic Party (UDP) 728 (2%)
Progressive Unionist Party (PUP) 652 (2%)
Northern Ireland Women's Coalition (NIWC) 375 (1%)
Labour (Lab) 241 (1%)
Conservative Party (Con) 208 (1%)
Green Party 189 (1%)
Ulster Independence Movement (UIM) 100 (0.27%)
Workers Party (WP) 75 (0.20%)
Democratic Left (DL) 45 (0.12%)
Natural Law Party (NLP) 14
Independent Chambers 5 (0.01%)
Electorate: 58,471; votes cast: 36,893 (63.1%); spoilt votes: 99 (0.2%); valid votes: 36,794
| DUP | UUP | Oth U | Alliance | Oth | SDLP | SF | |
| 2007a |
40% | 18% | 2% | 4% | 3% | 13% | 20% |
| 2005w | 43% | 21% | 3% | 0% | 17% | 16% | |
| 2005lg | 32% | 24% | 4% | 3% | 4% | 16% | 17% |
| 2003a | 32% | 23% | 8% | 2% | 0% | 16% | 18% |
| 2001w | 32% | 27% | 4% | 21% | 16% | ||
| 2001lg | 24% | 28% | 4% | 4% | 8% | 23% | 10% |
| 1998a | 24% | 25% | 12% | 6% | 0% | 24% | 10% |
| 1997lg | 18% | 35% | 5% | 5% | 25% | 9% | |
| 1997w | 26% | 36% | 1% | 6% | 0% | 22% | 9% |
| 1996f | 24% | 31% | 7% | 6% | 3% | 20% | 9% |
See also: Full 2003 results from East Londonderry | Full 1998 results from East Londonderry | The Boundary Commission's Provisional Recommendations | Boundary Commission 2003 | Jim Riley's analysis of votes and seats in the 1998 Assembly election | The constituencies
Other sites based at ARK: ORB (Online Research Bank) | CAIN (Conflict Archive on the INternet) | Northern Ireland Life and Times Survey
Your comments, please! Send an email to me at nicholas.whyte@gmail.com.
 |
This page has been developed with the support of a project grant from the New Initiatives Fund of the Electoral Commission. However, any views expressed on this page or, in particular, other pages of this website are those of the author and not necessarily shared by The Electoral Commission. |
Nicholas Whyte, 3 June 1998; last updated 7 May 2022 by Conal Kelly.
|
Disclaimer:� Nicholas Whyte 1998-2015
|