
 |
 |
|
|
|
|


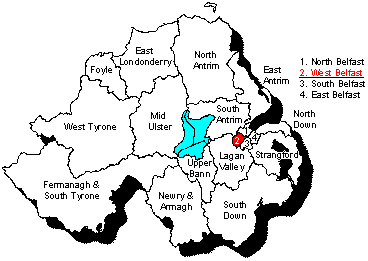
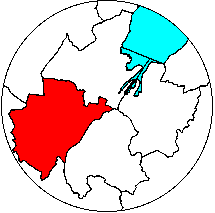
Maps by Conal Kelly and Nicholas Whyte
See also results of all West Belfast elections 1993-2010 and full counts from 2003 and 2007. Spreadsheet for 1998 here.
| |
Stage 1 | Surplus Adams | Exclude McGuinness, Cahillane, Kennedy | Surplus Hendron | ||||
| Gerry Adams | SF | 9078 | -3107 | 5971 | |
5971 | |
5971 |
| Joe Hendron | SDLP | 6140 | |
6140 | |
6140 | -169.00 | 5971 |
| Sue Ramsey | SF | 3946 | 1277.15 | 5223.15 | 11.85 | 5235.00 | 1.44 | 5236.44 |
| Bairbre de Brún | SF | 4711 | 630.00 | 5341.00 | 40.35 | 5381.35 | 2.48 | 5383.83 |
| Alex Maskey | SF | 4330 | 501.20 | 4831.20 | 21.15 | 4852.35 | 4.06 | 4856.41 |
| Alex Attwood | SDLP | 4280 | 367.85 | 4647.85 | 90.40 | 4738.25 | 100.60 | 4838.85 |
| Chris McGimpsey | UUP | 1640 | 1.40 | 1641.40 | 33.00 | 1674.40 | 1.18 | 1675.58 |
| Michael Ferguson | SF | 2585 | 206.85 | 2791.85 | 46.60 | 2838.45 | 2.26 | 2840.71 |
| Hugh Smyth | PUP | 2180 | 6.65 | 2186.65 | 20.10 | 2206.75 | 1.88 | 2208.63 |
| Margaret Ferris | DUP | 1345 | 2.80 | 1347.80 | 6.70 | 1354.50 | 0.30 | 1354.8 |
| Thomas Dalzell-Sheridan | UKUP | 666 | 5.25 | 671.25 | 6.00 | 677.25 | 0.12 | 677.37 |
| John Lowry | WP | 607 | 23.10 | 630.10 | 26.70 | 656.80 | 3.88 | 660.68 |
| Daniel McGuinness | APNI | 129 | 36.40 | 165.40 | -165.40 | |
|
|
| Mary Cahillane | Soc | 128 | 23.80 | 151.80 | -151.80 | |
|
|
| Michael Kennedy | NLP | 29 | 2.45 | 31.45 | -31.45 | |
|
|
| |
|
|
|
|
|
|
|
|
| non-transferable | |
|
22.10 | 22.10 | 45.80 | 67.90 | 50.80 | 118.70 |
Stage 2: Of Adams' 9078 votes, 3649 transferred to Ramsey, 1800 to de Brún, 1432 to Maskey and 591 to Ferguson, thus 7472 (82.31%) to the other SF candidates; 1051 (11.58%) to Attwood (SDLP); 104 (1.15%) to McGuinness (Alliance); 68 (0.75%) to Cahillane (Socialist); 66 (0.73%) to Lowry (WP); 19 (0.21%) to Smyth (PUP); 15 (0.17%) to Dalzell-Sheridan (UKUP); 8 (0.09%) to Ferris (DUP); 7 (0.08%) to Kennedy (NLP); and 4 (0.04%) to McGimpsey (UUP) with 264 (2.91%) non-transferable.
Stage 4: Of Hendron's 6140 votes, 5030 (81.92%) transferred to Attwood (SDLP); 512 to Ramsey, 124 to Maskey, 113 to Ferguson and 72 to de Brún, thus 512 (8.34%) to the SF candidates; 194 (3.16%) to Lowry (WP); 94 (1.53%) to Smyth (PUP); 59 (0.96%) to McGimpsey (UUP); 15 (0.24%) to Ferris (DUP); and 6 (0.10%) to Dalzell-Sheridan (UKUP) with 230 (3.75%) non-transferable.
| |
Stage 4 | Exclude Dalzell-Sheridan, Lowry | Exclude Ferris | Exclude Smyth | ||||
| Gerry Adams | SF | 5971 | |
5971 | |
5971 | |
5971 |
| Joe Hendron | SDLP | 5971 | |
5971 | |
5971 | |
5971 |
| Sue Ramsey | SF | 5236.44 | 16.83 | 5253.27 | 9.35 | 5262.62 | 13.72 | 5276.34 |
| Bairbre de Brún | SF | 5383.83 | 21.28 | 5405.11 | 4.00 | 5409.11 | 12.78 | 5421.89 |
| Alex Maskey | SF | 4856.41 | 32.79 | 4889.20 | 12.07 | 4901.27 | 8.55 | 4909.82 |
| Alex Attwood | SDLP | 4838.85 | 279.02 | 5117.87 | 9.35 | 5127.22 | 107.27 | 5234.49 |
| Chris McGimpsey | UUP | 1675.58 | 133.41 | 1808.99 | 948.45 | 2757.44 | 2069.85 | 4827.29 |
| Michael Ferguson | SF | 2840.71 | 26.41 | 2867.12 | 4.72 | 2871.84 | 25.11 | 2896.95 |
| Hugh Smyth | PUP | 2208.63 | 134.31 | 2342.94 | 373.12 | 2716.06 | -2716.06 | |
| Margaret Ferris | DUP | 1354.80 | 429.42 | 1784.22 | -1784.22 | |
|
|
| Thomas Dalzell-Sheridan | UKUP | 677.37 | -677.37 | |
|
|
|
|
| John Lowry | WP | 660.68 | -660.68 | |
|
|
|
|
| |
|
|
|
|
|
|
|
|
| non-transferable | |
118.70 | 264.58 | 383.28 | 423.16 | 806.44 | 478.78 | 1285.22 |
| |
Stage 7 | Exclude Ferguson | Surplus Ramsey | Surplus de Brún | ||||
| Gerry Adams | SF | 5971 | |
5971 | |
5971 | |
5971 |
| Joe Hendron | SDLP | 5971 | |
5971 | |
5971 | |
5971 |
| Sue Ramsey | SF | 5276.34 | 2095.00 | 7371.34 | -1400.34 | 5971 | |
5971 |
| Bairbre de Brún | SF | 5421.89 | 283.37 | 5705.26 | 1288.41 | 6993.67 | -1022.67 | 5971 |
| Alex Maskey | SF | 4909.82 | 332.38 | 5242.2 | 82.41 | 5324.61 | 1003.82 | 6328.43 |
| Alex Attwood | SDLP | 5234.49 | 93.12 | 5327.61 | 16.08 | 5343.69 | 5.83 | 5349.52 |
| Chris McGimpsey | UUP | 4827.29 | 10.35 | 4837.64 | |
4837.64 | |
4837.64 |
| Michael Ferguson | SF | 2896.95 | -2896.95 | |
|
|
|
|
| |
|
|
|
|
|
|
|
|
| non-transferable | |
1285.22 | 82.73 | 1367.95 | 13.44 | 1381.39 | 13.02 | 1394.41 |
Stage 9: Of the 2095 votes transferred to Ramsey from Ferguson, 1923 transferred to de Brún (enough to elect her) and 123 to Maskey, thus 2046 (97.66%) to the other SF candidates; 24 (1.15%) to Attwood (SDLP) and none to McGimpsey (UUP) with 25 (1.19%) non-transferable.
Stage 10: Of the 2046 votes transferred to de Brún from Ramsey (and Ferguson), 1894 (92.57%) transferred to Maskey (SF); 11 (0.54%) to Attwood (SDLP); and none to McGimpsey (UUP) with 141 (6.89%) non-transferable.
The failure of even one Unionist candidate to win a seat was not all that surprising given recent voting patterns. A strong result for Sinn Féin in their strongest constituency.
Full 1998 results for each seat: East Belfast | North Belfast | South Belfast | West Belfast | East Antrim | North Antrim | South Antrim | North Down | South Down | Fermanagh and South Tyrone | Foyle | Lagan Valley | East Londonderry | Mid Ulster | Newry and Armagh | Strangford | West Tyrone | Upper Bann
Other sites based at ARK: ORB (Online Research Bank) | CAIN (Conflict Archive on the INternet) | Northern Ireland Life and Times Survey
Your comments, please! Send an email to me at nicholas.whyte@gmail.com..
Nicholas Whyte, 15 October 2000; modified 16 February 2002.
|
|
Disclaimer:©
Nicholas Whyte 1998-2004 Last Updated onSunday,
21-Mar-2010 10:46
|