

| |
|
|
|
|
|
|
 |
| Map and graph by Conal Kelly | |
This constituency is the western shore of Lough Neagh. It takes in
a large part of Mid
Ulster District Council. The member of parliament has been
Cathal Mallaghan (SF) since 2024; he replaced Francie Molloy (SF)
who had previously replaced Martin McGuinness (SF) in 2013. The
latter had held the seat since its drastic reshaping in 1997; the
previous MP was William McCrea (DUP). Sinn Féin hold three out of
five Assembly seats here, with the DUP and SDLP holding the other
two. See the 1983-92 results from Mid
Ulster, Fermanagh
and South Tyrone and East
Londonderry).
This was one boundary change that I called completely
incorrectly. I had expected that Mid Ulster would stretch north
towards Dungiven, as had been the case in the previous quashed
proposals. But in fact it takes a chunk of Coalisland from
Femanagh and South Tyrone, which losing a large but sparsely
populated chunk to West Tyrone.
It didn’t make a lot of difference.
2024 Westminster election
Cathal Mallaghan (SF) 24,085 (53.0%, +7.3%)
Keith Buchanan (DUP) 9,162 (20.2%, -3.6%)
Denise Johnston (SDLP) 3,722 (8.2%, -5.7%)
Glenn Moore (TUV) 2,978 (6.6%)
Jay Basra (UUP) 2,269 (5.0%, -2.5%)
Padraic Farrell (Alliance) 2,001 (4.4%, -3.2%)
Alixandra Halliday (Aontú) 1,047 (2.3%)
John Kelly (Ind) 181 (0.4%)
Electorate 74,000; turnout 45,691 (61.7%)
45,445 246
Consolidation from SF (which was the story of the night in their
seats generally). In a five-seat Assembly election these votes
would give SF three seats, the DUP one and probably the TUV one -
Unionists are closer to a second quota than Nationalists.
2019 Westminster notional result on new boundaries:
SF 20,371 (45.7%)
DUP 10,566 (23.7%)
SDLP 6,193 (13.9%)
Alliance 3,395 (7.6%)
UUP 3,316 (7.4%)
Ind 690 (1.5%)
See spreadsheets from the 2011 Assembly
election, the 2010
Westminster election, the 2007 Assembly
election, the
2005 Westminster election, the 2003 Assembly
election, the
2001 Westminster election, the 1998 Assembly
election, the
1997 Westminster election and the 1996 Forum/talks
election. See also the detailed
guide from 2007 by "Sammy Morse".
| DUP | UUP | Alliance | Ind | SDLP | SF | ||
| 2019 actual |
10,936 | 2,611 | 3,526 | 690 | 6,384 | 20,473 | |
| 24.5% | 5.9% | 7.9% | 1.5% | 14.3% | 45.9% | ||
| From Mid Ulster |
To Mid Ulster | 10,566 | 2,523 | 3,284 | 690 | 6,031 | 19,342 |
| From Mid Ulster | To West Tyrone |
-234 | -56 | -198 | -273 | 877 | |
| From Mid Ulster | To Fermanagh and South Tyrone | -136 | -32 | -44 | -79 | 255 | |
| From Fermanagh and South Tyrone |
To Mid Ulster | 793 | 111 | 162 | 1,031 | ||
| 2019 notional | 10,566 | 3,316 | 3,395 | 690 | 6,193 | 20,372 | |
| 23.7% | 7.4% | 7.6% | 1.5% | 13.9% | 45.7% | ||
| -0.8% | 1.6% | -0.3% | 0.0% | -0.4% | -0.1% |
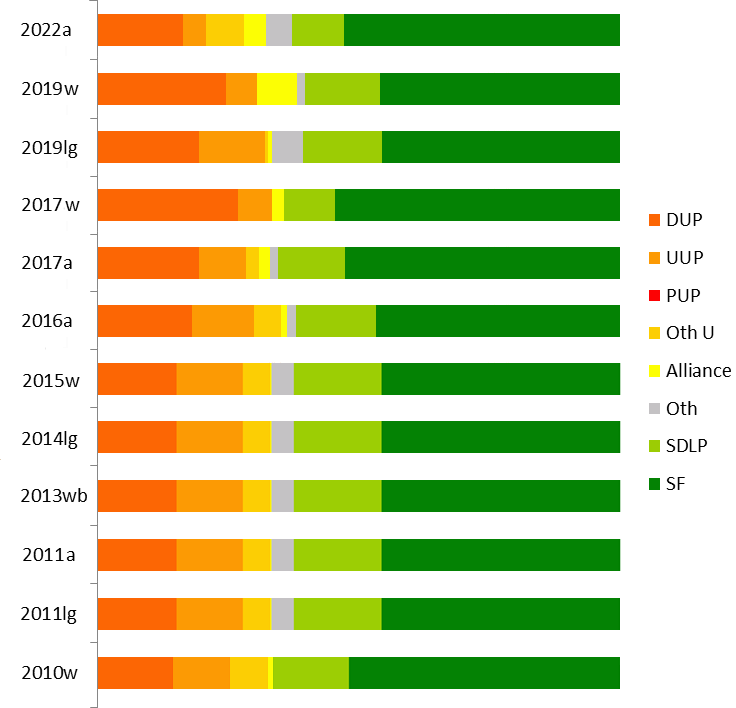
| DUP | UUP | Oth U | Alliance | Oth | SDLP | SF | |
| 2024w | 20.2% |
5.0% |
6.6% |
4.4% |
2.7% |
8.2% |
53.0% |
| 2022a | 16.5% | 4.2% | 7.4% | 4.1% | 5.1% | 10.0% | 52.7% |
| 2019w | 24.5% | 5.9% | 7.9% | 1.5% | 14.3 | 45.9% | |
| 2019lg |
19.3% | 12.7% | 0.5% | 0.7% | 6.1% | 15.0% | 45.6% |
| 2017w | 26.9% | 6.5% | 2.3% | 9.8% | 54.5% | ||
| 2017a |
19.3% | 9.1% | 2.5% |
2.0% | 1.4% |
12.9% | 52.8% |
| 2016a |
18.1% | 11.9% | 5.2% | 1.2% | 1.7% | 15.2% | 46.7% |
| 2015w |
13.4% | 15.4% | 7.0% | 1.9% | 1.2% | 12.4% | 48.7% |
| 2014lg |
16.2% | 16.7% | 5.8% | 0.3% | 3.4% | 16.4% | 41.2% |
| 2013wb |
34.4% | 1.3% | 17.4% | 46.9% | |||
| 2011a |
16.7% | 10.3% | 4.9% | 0.9% | 3.4% | 14.7% | 49.2% |
| 2011lg |
15.1% | 12.7% | 5.2% | 0.2% | 4.3% | 16.7% | 45.7% |
| 2010w | 14.4% | 11.0% | 7.3% | 1.0% | 14.3% | 52.0% | |
| 2007a |
19.5% | 10.8% | 2.7% | 0.5% | 1.4% | 17.5% | 47.6% |
| 2005w | 23.5% | 10.7% | 0.8% | 17.4% | 47.6% | ||
| 2005lg | 19.4% | 10.3% | 7.2% | 17.4% | 46.1% |
NB that the figures for elections before 2010 are projections.
| @Michelle O'Neill
(SF) 10,845 (21.0%) @Keith Buchanan (DUP) 8,521 (16.5%) @Emma Sheerin (SF) 8,215 (15.9%) @Linda Dillon (SF) 8,199 (15.9%) @Patsy McGlone (SDLP) 5,144 (10.0%) Glenn Moore (TUV) 3,818 (7.4%) Meta Graham (UUP) 2,191 (4.2%) Claire Hackett (Alliance) 2,138 (4.1%) Alixandra Halliday (Aontú) 1,305 (2.5%) Patrick Haughey (Ind) 877 (1.7%) Sophia McFeely (PBP) 179 (0.3%) Stefan Taylor (Green) 137 (0.3%) Hugh Scullion (WP) 107 (0.2%) Conor Rafferty (Resume) 13 (0.03%) @ member of the Assembly when it was dissolved. |
SF 27,259 (52.7%, -0.1%)
3 seats DUP 8,521 (16.5%, -2.8%) 1 seat SDLP 5,144 (10.0%, -2.9%) 1 seat TUV 3,818 (7.4%, +4.9%) UUP 2,191 (4.2%, -4.9%) Alliance 2,138 (4.1%, +2.1%) Aontú 1,305 (2.5%) Ind 877 (1.7%) PBP 179 (0.3%) Green 137 (0.3%, -0.2%) WP 107 (0.2%, -0.2%) Resume 13 (0.03%) Electorate: 75,168 Votes cast: 52,274 (69.5%, -2.9%), spoilt votes 585 (1.1%) Valid votes: 51,689, quota 8,615 |
*Francie Molloy (SF) 20,473 (45.9%, -8.6%)
@Keith Buchanan (DUP) 10,936 (24.5%, -2.4%)
Denise Johnston (SDLP) 6,384 (14.3%, +4.5%)
Mel Boyle (Alliance) 3,526 (7.9%, +5.6%)
Neil Richardson (UUP) 2,611 (5.9%, -0.6%)
Conor Rafferty (Ind) 690 (1.5%, +1.5%)
* outgoing MP.
@ member of the Assembly.
Electorate: 70,449; Total Poll: 44,968 (63.8%); Invalid Votes:
348 (0.8%); Valid Votes: 44,620
Comfortable victory for the incumbent with SF losing slightly
more votes to SDLP than Alliance, but Alliance also picking up
from Unionists. In a five-seat Assembly election, these votes
would give SF three seats and one each for the DUP and SDLP.
From the 2011 census, the Mid Ulster constituency includes:
The entire Mid Ulster DEA of Carntogher
*Francie Molloy (SF) 25,455 (54.5%, +5.8%)
@Keith Buchanan (DUP) 12,565 (26.9%, +13.5%)
Malachy Quinn (SDLP) 4,563 (9.8%, -2.6%)
Mark Glasgow (UUP) 3,017 (6.5%, -8.9%)
Fay Watson (Alliance) 1,094 (2.3%, +0.4%)
* outgoing MP.
@ member of the Assembly.
Electorate: 68,485; Total Poll:
46,975; Invalid Votes: 278 (0.6%); Valid Votes: 46,697
Convincing result for Molloy; notable also the big shift of
Unionist support to the DUP. In a five-seat Assembly election,
these votes would give SF three seats and the DUP two.
| @Michelle O'Neill
(SF) 10,258 (20.6%) @Keith Buchanan (DUP) 9,568 (19.3%) @Ian Milne (SF) 8,143 (16.4%) @Linda Dillon (SF) 7,806 (15.7%) @Patsy McGlone (SDLP) 6,419 (12.9%) @Sandra Overend (UUP) 4,516 (9.1%) Hannah Loughrin (TUV) 1,244 (2.5%) Fay Watson (Alliance) 1,017 (2.0%) Hugh McCloy (Ind) 247 (0.5%) Stefan Taylor (Green) 243 (0.5%) Hugh Scullion (WP) 217 (0.4%) @ member of the Assembly when it was dissolved. |
SF 26,207 (52.8%, +6.1%)
3 seats DUP 9,568 (19.3%, +1.2%) 1 seat SDLP 6,419 (12.9%, -2.3%) 1 seat UUP 4,516 (9.1%, -2.8%) 0 seats (-1) TUV 1,244 (2.5%, -2.1%) Alliance 1,017 (2.0%, +0.8%) Ind 247 (0.5%) Green 243 (0.5%, -0.4%) WP 217 (0.4%, -0.4%) Electorate: 69,396 Votes cast: 50,228 (72.4%, +13.6%), spoilt votes 550 (1.1%) Valid votes: 49,678, quota 8,280 |
| @Ian Milne (Sinn Féin)
7,035 (17.3%) @Patsy McGlone (SDLP) 6,209 (15.2%) @Michelle O'Neill (Sinn Féin) 6,147 (15.1%) Linda Dillon (Sinn Féin) 5,833 (14.3%) @Sandra Overend (UUP) 4,862 (11.9%) @Ian McCrea (DUP) 3,765 (9.2%) Keith Buchanan (DUP) 3,628 (8.9%) Hanna Loughrin (TUV) 1,877 (4.6%) Hugh Scullion (Workers' Party) 316 (0.8%) Néidín Hendron (Alliance) 471 (1.2%) Stefan Taylor (Green) 349 (0.9%) Alan Day (UKIP) 256 (0.6%) @ member of the Assembly when it was dissolved. |
Sinn Féin 19,015 (46.7%,
-2.5%) 3 seats DUP 7,393 (18.1%, +1.4%) 1 seat SDLP 6,209 (15.2%, +0.5%) 1 seat UUP 4,862 (11.9%, +1.6%) 1 seat TUV 1,877 (4.6%, -0.3%) Alliance 471 (1.2%, +0.3%) Green 349 (0.9%) Workers' Party 316 (0.8%) UKIP 256 (0.6%) Electorate: 70,430 Votes cast: 41,381 (58.8%); spoilt votes: 633 (1.8%) Valid votes: 40,748; quota 5,822 |
*Francie Molloy (SF) 19,935 (48.7%, -3.3%)
Sandra Overend (UUP) 6,318 (15.4%, +4.4%)
Ian McCrea (DUP) 5,465 (13.4%, -1.0%)
Malachy Quinn (SDLP) 5,055 (12.4%, -1.9%)
Gareth Ferguson (TUV) 1,892 (4.6%, -2.7%)
Alan Day (UKIP) 863 (2.1%)
Eric Bullick (Alliance) 778 (1.9%, +0.9%)
Hugh Scullion (WP) 496 (1.2%)
Lucille Nicholson (Conservative) 120 (0.3%)
Electorate: 67,832; Total Poll: 41,317; Invalid Votes: 395 (1.0%);
Valid Votes: 40,922
One of the least unexpected results in Northern Ireland, though
the UUP have overtaken the DUP for the first time since the 1997
local elections.
If cast in a six-seat Assembly election, these votes would give SF
three seats, and the UUP, DUP and SDLP one each.
From the 2011 census, the Mid Ulster constituency includes:
The entire Mid Ulster DEA of Carntogher
@Francie Molloy (SF) 17,462 (46.9%, -5.1%)
Nigel Lutton (Independent) 12,781 (34.4%)
@Patsy McGlone (SDLP) 6,478 (17.4%, +3.1%)
Eric Bullick (Alliance) 487 (1.3%, +0.3%)
The by-election was caused by Martin McGuinness resigning in
order to concentrate on his duties as Deputy First Minister.
Lutton stood with support from both UUP and DUP, and scored 1.71%
more than their combined total in 2010.
If cast in a six-seat Assembly election, these votes would have
seen 3 SF, 1 SDLP and 2 Unionists elected.
| @Martin McGuinness MP (SF) 8,957 (21.0%) @Ian McCrea (DUP) 7,127 (16.7%) @Michelle O'Neill (SF) 5,178 (12.1%) @Patsy McGlone (SDLP) 5,065 (11.9%) Sandra Overend (UUP) 4,409 (10.3%) @Francie Molloy (SF) 4,263 (10.0%) Ian Milne (SF) 2,635 (6.2%) Walter Millar (TUV) 2,075 (4.9%) Austin Kelly (SDLP) 1,214 (2.8%) Hugh McCloy (Independent) 933 (2.2%) Michael McDonald (Alliance) 398 (0.9%) Harry Hutchinson (PBPA) 243 (0.6%) Gary McCann (Independent) 241 (0.6%) @ member of the Assembly when it was dissolved. |
SF 21,033 (49.2%, +1.6%) 3 seats DUP 7,127 (16.7%, -2.8%) 1 seat SDLP 6,279 (14.7%, -2.8%) 1 seat UUP 4,409 (10.3%, -0.5%) 1 seat TUV 2,075 (4.9%) Independents 1,174 (2.8%) Alliance 398 (0.9%, +0.4%) PBPA 243 (0.6%) Electorate: 66,602 Votes cast: 43,522 (65.3%); spoilt votes: 784 (1.8%) Valid votes: 42,738; quota 6,106 |
*@Martin McGuinness (Sinn Féin)
21,239 (52.0%, +4.4%)
@ Ian McCrea (DUP) 5,876 (14.4%, -9.1%)
Tony Quinn (SDLP) 5,826 (14.3%, -3.1%)
Sandra Overend (UCUNF) 4,509 (11.0%, +0.3%)
Walter Millar (TUV) 2,995 (7.3%)
Ian Butler (Alliance) 397 1.0%
Electorate: 64,594; Total Poll: 41,139 (63.7%); Invalid Votes: 297
(0.7%); Valid Votes: 40,842
A solid hold for McGuinness, and another seat where the TUV failed to hit the big time. If cast in a six-seat Assembly election, these votes would probably see no change in the distribtuion of MLAs between the parties, SF not quite being in position to win a fourth seat yet.
| *Martin McGuinness MP
(SF) 8065 (18.2%) Ian McCrea (DUP) 7608 (17.2%) *Francis Molloy (SF) 6597 (14.9%) Michelle O'Neill (SF) 6432 (14.5%) *Patsy McGlone (SDLP) 4976 (11.2%) *Billy Armstrong (UUP) 4781 (10.8%) Kathleen Lagan (SDLP) 2759 (6.2%) Walter Millar (UKUP) 1210 (2.7%) Elizabeth Forde (DUP) 1021 (2.3%) Brendan McLaughlin (RSF) 437 (1.0%) Margaret Marshall (Alliance) 221 (0.5%) Harry Hutchinson (Independent) 170 (0.4%) *Elected in 2003 from Mid Ulster |
SF 21,094 (47.6%, +2.1%) 3
seats DUP 8,629 (19.5%, -1.3%) 1 seat SDLP 7,735 (17.5%, -0.9%) 1 seat UUP 4,781 (10.8%, -3.6%) 1 seat UKUP 1,210 (2.7%) RSF 437 (1.0%) Alliance 221 (0.5%, +0.1%) Hutchinson 170 (0.4%) Electorate 61,223 Votes cast 44,728 (73.1%); spoilt votes 451 (1.0%) Valid votes 44,277; quota 6,326 |
*@Martin McGuinness (Sinn Fein) 21,641 (47.6% -3.5%)
Ian McCrea (DUP) 10,665 (23.5% -7.6%)
@Patsy McGlone (SDLP) 7,922 (17.4% +0.6%)
@Billy Armstrong (UUP) 4,853 (10.7%)
Francis Donnelly (WP) 345 (0.8% -0.2%)
* outgoing MP.
@ Member of the Assembly
If cast in a six-seat STV election, these votes would give Sinn Fein three seats, the SDLP one, and the DUP one, with the last between the DUP and UUP.
Votes cast in Cookstown, Magherafelt and the Torrent DEA of Dungannon were as follows:
Sinn Fein 17,828 (46.1%)
DUP 7,495 (19.4%)
SDLP 6,581 (17.0%)
UUP 3,991 (10.3%)
Independents 2,599 (6.7%)
WP 102 (0.3%)
Socialist Party 84 (0.2%)
NB that there was no contest in the Ballinderry DEA of Cookstown, as only six candidates stood for six seats; if there had been, the overall vote share for SF would probably have been a little lower, and those of the UUP and SDLP a bit higher. If cast in a six-seat STV election, these votes would have given SF three seats and the DUP, SDLP and UUP one each.
| *William
McCrea (DUP) 8211 (18.5%) *Martin McGuinness (SF) 8128 (18.3%) Geraldine Dougan (SF) 5827 (13.1%) *Francis Molloy (SF) 5255 (11.8%) *Billy Armstrong (UUP) 4323 (9.7%) Patsy McGlone (SDLP) 4295 (9.7%) *Denis Haughey (SDLP) 3843 (8.7%) Trevor Wilson (UUP) 2071 (4.7%) Alan Miller (DUP) 1029 (2.3%) Cora Groogan (SF) 984 (2.2%) Francis Donnelly (WP) 230 (0.5%) James Holmes (Alliance) 166 (0.4%) |
SF 20,194 (45.5%, +4.7%) 3
seats DUP 9,240 (20.8%, -0.6%) 1 seat SDLP 8,138 (18.3%, -3.9%) 1 seat UUP 6,394 (14.4%, +0.5%) 1 seat WP 230 (0.5%, +0.1%) Alliance 166 (0.4%, -0.6%) Electorate 60,095 |
Reaction: No change in party strengths, though Denis Haughey lost to running-mate Patsy McGlone by 634 votes.
Mid Ulster had lost 7.26% of its electorate in the great electoral register shake-out, less than any other constituency, varying from 12.34% in the Coalisland South ward of Dungannon to 3.29% in the Upperlands ward of Magherafelt.Electorate: 61,390; votes cast: 50,388 (82.0%); spoilt votes: 452
(0.9%)
Valid votes: 49,936; SF majority 9,953
* outgoing MP
@ member of the Assembly
Another good result for SF, increasing their vote in their second strongest constituency. A six-seat Assembly election on these figures would have given them three seats, the DUP two and SDLP one.
SF 20800 (41%)
SDLP 10159 (20%)
DUP 8378 (17%)
UUP 7209 (15%)
WP 104 (0.2%)
Inds 2919 (6%)
Total valid votes 38,646 (75.74% of electorate)
If these votes had been cast in a six-seat STV election, Sinn Fein would have won three seats and the SDLP, DUP and UUP one each.
| *William McCrea (DUP) 10,339 #Martin McGuinness (SF) 8,703 Denis Haughey (SDLP) 6,410 *Francie Molloy (SF) 6,008 John Kelly (SF) 5,594 *Patsy McGlone (SDLP) 4,666 Billy Armstrong (UUP) 4,498 *John Junkin (UUP) 2,440 Yvonne Boyle (Alliance) 497 Paul McLean (DUP) 307 Francie Donnelly (WP) 207 Harry Hutchinson (Pro-Agreement Socialist) 91 Mary Daly (NLP) 38 |
SF 20,305 (40.77%) 3 seats
SDLP 11,076 (22.24%) 1 seat DUP 10,646 (21.38%) 1 seat UUP 6,938 (13.93%) 1 seat All 497 (1.00%) WP 207 (0.42%) Soc 91 (0.18%) NLP 38 (0.08%) Electorate: 59,991 |
* elected in 1996 Forum/talks election from Mid Ulster
# elected in 1996 Forum/talks election from Foyle
The third Sinn Féin seat took everyone by surprise, though it had been presaged in Martin McGuinness' victory in the 1997 Westminster election. Patsy McGlone of the SDLP began in sixth place, but there were not enough SDLP votes to elect him and he was overtaken by the UUP when their second candidate was eliminated. Had the two SDLP candidates balanced their votes slightly better, UUP transfers would have elected McGlone at the expense of Captain Kelly. As it was Kelly was ahead on the last count by 5,914 to 5,076, with an undistributed UUP surplus of 352 votes which might have narrowed the gap.
Sinn Féin 13,845 votes (36%)
Social Democratic and Labour Party 8,914 votes (23%)
Ulster Unionist Party 7,012 votes (18%)
Democratic Unionist Party 6,673 votes (17%)
Independent 1,183 votes (3%)
Independent Unionist 741 votes (2%)
Workers Party 140 votes (0.36%)
Labour 73 votes (0.19%)
Independent Nationalist 53 votes (0.14%)
Green Party 12 votes (0.03%)
Total valid votes 38,646 (75.74% of electorate)
Sinn Féin (SF) 13,001 (30%); Francie Molloy, Patrick Groogan
elected
Social Democratic and Labour Party (SDLP) 12,492 (28%); Patsy
McGlone elected
Ulster Unionist Party (UUP) 7,935 (18%); John Junkin elected
Democratic Unionist Party (DUP) 7,243 (17%); Rev William McCrea
elected
Alliance Party of Northern Ireland (APNI) 549 (1%)
United Kingdom Unionist Party (UKUP) 435 (1%)
Progressive Unionist Party (PUP) 380 (1%)
Ulster Democratic Party (UDP) 375 (1%)
Labour (Lab) 271 (1%)
Ulster Independence Movement (UIM) 263 (1%)
Northern Ireland Women's Coalition (NIWC) 259 (1%)
Workers Party (WP) 210 (0.48%)
Green Party 132 (0.30%)
Conservative Party (Con) 119 (0.27%)
Democratic Partnership 93 (0.21%)
Democratic Left (DL) 41 (0.09%)
Natural Law Party (NLP) 24 (0.05%)
Independent Chambers 20 (0.05%)
Electorate: 57,683; votes cast: 44,001 (76.2%); spoilt votes: 159 (0.3%); valid votes: 43,842
McCrea had been elected to the 1982 Assembly from Mid-Ulster.
| DUP | UUP | Oth U | Alliance | Oth | SDLP | SF | |
| 2007a |
19% | 11% | 3% | 0% | 1% | 17% | 48% |
| 2005w | 23% | 11% | 1% | 17% | 48% | ||
| 2005lg | 19% | 10% | 7% | 17% | 46% | ||
| 2003a | 21% | 14% | 0% | 1% | 18% | 46% | |
| 2001w | 31% | 1% | 17% | 51% | |||
| 2001lg | 17% | 15% | 6% | 20% | 41% | ||
| 1998a | 21% | 14% | 1% | 1% | 22% | 41% | |
| 1997lg | 17% | 18% | 2% | 3% | 23% | 36% | |
| 1997w | 36% | 1% | 1% | 22% | 40% | ||
| 1996f | 17% | 18% | 3% | 1% | 3% | 28% | 30% |
See also: Full 2003 results from Mid Ulster | Full 1998 results from Mid Ulster | The Boundary Commission's Provisional Recommendations | Boundary Commission 2003 | Jim Riley's analysis of votes and seats in the 1998 Assembly election | The constituencies
Other sites based at ARK: ORB (Online Research Bank) | CAIN (Conflict Archive on the INternet) | Northern Ireland Life and Times Survey
Your comments, please! Send an email to me at nicholas.whyte@gmail.com.
 |
This page has been developed with the support of a project grant from the New Initiatives Fund of the Electoral Commission. However, any views expressed on this page or, in particular, other pages of this website are those of the author and not necessarily shared by The Electoral Commission. |
Nicholas Whyte, 3 June 1998; last updated 7 May 2022 by Conal Kelly.
|
Disclaimer:� Nicholas Whyte 1998-2015
|