
 |
 |
|
|
|
|

|
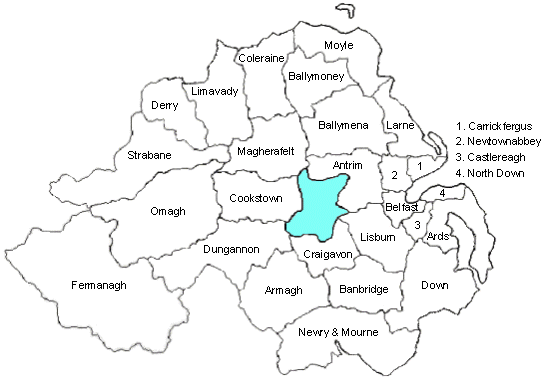
Map by Conal Kelly
The elections for Northern Ireland's 26 local councils took place
on
5 May, 2005, simultaneously with the Westminster
election.
This was the ninth set of elections since the local councils were
reorganised in 1973, and the fourth on the boundaries set up for
the
1993 elections. Councillors are elected for a four-year term by Single Transferable Vote from local
electoral
areas returning five, six or seven councillors. You can look at
all the
local election results since 1973 here,
and compare specifically with the 2001
elections
here , the 1997 elections here and
the 1993 elections here. You may also
like to look at
entries to the prediction contest.
(See spreadsheet archive.)
I have acquired my figures from the BBC, cross-checked with local knowledge where possible. First preferences for all electoral areas will be added to the respective council pages as soon as possible.
These elections saw further advances for the DUP and Sinn
Féin at the expense of the other main parties and smaller
groupings (apart from Alliance, which held its ground).
| DUP | 208,278 | 30% | 182 cllrs |
| SF | 163,205 | 23% | 126 cllrs |
| UUP | 126,317 | 18% | 115 cllrs |
| SDLP | 121,991 | 17% | 101 cllrs |
| Alliance | 35,149 | 5% | 30 cllrs |
| Greens | 5,703 | 1% | 3 cllrs |
| PUP | 4,591 | 1% | 2 cllrs |
| UUC | 2,064 | 0.3% | 2 cllrs |
| Newtownabbey Ratepayers Association | 1,897 | 0.3% | 1 cllr |
| Socialist Environmental Alliance | 1,321 | 0.2% | |
| Conservatives | 1,164 | 0.2% | |
| Workers Party | 1,052 | 0.1% | |
| Socialist Party | 828 | 0.1% | |
| Women's Coalition | 738 | 0.1% | |
| UKUP | 734 | 0.1% | |
| Independents | 27,677 | 4% | 20 cllrs |
Total valid vote: 702,749
| Council | DUP | UUP | Alliance | Others | SDLP | SF | Total Seats |
| Antrim | 6+ | 5-- | 2++ | 0 | 3-- | 3+ | 19 |
| Ards | 12+++ | 7- | 3- | 0 | 1 | 0 | 23 |
| Armagh | 6++ | 5-- | 0 | 0 | 6 | 5 | 22 |
| Ballymena | 14+++ | 5-- | 0 | 1 Ind | 3- | 1+ | 24 |
| Ballymoney | 8 | 2--- | 0 | 1 Ind | 2 | 3++ | 16 |
| Banbridge | 7++ | 5-- | 1 | 0- | 3 | 1+ | 17 |
| Belfast | 15+++++ | 7---- | 4+ | 2 PUP, 1 Ind | 8- | 14 | 51 |
| Carrickfergus | 8++ | 4 | 3-- | 2 Inds | 0 | 0 | 17 |
| Castlereagh | 13+++ | 4- | 4 | 0- | 2 | 0 | 23 |
| Coleraine | 9++ | 8-- | 0 | 1 Ind | 3- | 1+ | 22 |
| Cookstown | 3+ | 3 | 0 | 0 | 5+ | 5- | 16 |
| Craigavon | 9+++ | 6-- | 0 | 1 Ind | 4--- | 6++ | 26 |
| Derry | 5+ | 1- | 0 | 0 | 14 | 10 | 30 |
| Down | 3+ | 4-- | 0 | 1 Green | 10 | 5+ | 23 |
| Dungannon | 5++ | 4-- | 0 | 0 | 4 | 9+ | 22 |
| Fermanagh | 4++ | 5-- | 0 | 0 | 5+ | 9 | 23 |
| Larne | 5 | 4 | 2 | 2 Inds | 2 | 0 | 15 |
| Limavady | 3+ | 2- | 0 | 1 UUC | 3- | 6++ | 15 |
| Lisburn | 13++++++++ | 7------ | 3 | 0 | 3 | 4 | 30 |
| Magherafelt | 4+ | 2 | 0 | 0 | 2- | 8+ | 16 |
| Moyle | 2- | 3 | 0 | 3 Inds | 3- | 4+++ | 15 |
| Newry and Mourne | 2+ | 3- | 0 | 2 Inds, 1 Green | 9- | 13 | 30 |
| Newtownabbey | 12++++ | 6--- | 2+ | 1 Ind, 1 N'b'y R'payer, 1 UUC | 1- | 1 | 25 |
| North Down | 8+++ | 8 | 6+ | 2 Inds, 1 Green | 0 | 0 | 25 |
| Omagh | 3 | 3+ | 0 | 2 Inds | 3--- | 10++ | 21 |
| Strabane | 3 | 2 | 0 | 1 Ind | 2-- | 8+ | 16 |
| Total | 182 | 115 | 30 | 28 | 101 | 126 | 582 |
See also:
Other sites based at ARK: ORB (Online Research Bank) | CAIN (Conflict Archive on the INternet) | Northern Ireland Life and Times Survey
Your comments, please! Send an email to me at nicholas.whyte@gmail.com.
Nicholas Whyte, 10 May 2005.
|
|
Disclaimer:©
Nicholas
Whyte 2005 Last Updated on
Tuesday, May 10, 2005 23:32:51
|