
 |
 |
|
|
|
|
Wednesday March 26, 2025
|

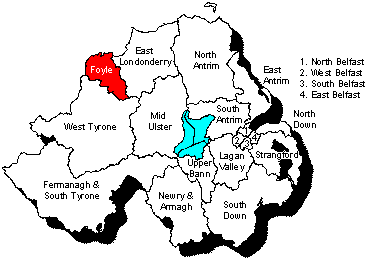
Map by Conal Kelly
See also results of all Foyle elections 1993-2010 and full counts from 2003 and 2007. Spreadsheet for 1998 here.
| |
Stage 1 | Surplus Hume | Exclude Adams, Gurney, MacKenzie, Brennan | Exclude Cavanagh | ||||
| John Hume | SDLP | 12581 | -5610 | 6971 | |
6971 | |
6971 |
| Mitchel McLaughlin | SF | 5341 | 526.50 | 5867.50 | 109.50 | 5977.00 | 30.90 | 6007.90 |
| Mark Durkan | SDLP | 4423 | 1980.00 | 6403.00 | 120.40 | 6523.40 | 289.50 | 6812.90 |
| John Tierney | SDLP | 3778 | 1517.40 | 5295.40 | 54.25 | 5349.65 | 107.55 | 5457.20 |
| Mary Nelis | SF | 3464 | 128.25 | 3592.25 | 50.95 | 3643.20 | 16.15 | 3659.35 |
| William Hay | DUP | 6112 | 16.20 | 6128.20 | 112.25 | 6240.45 | 53.35 | 6293.80 |
| Jack Allen | UUP | 4669 | 45.90 | 4714.90 | 205.15 | 4920.05 | 433.65 | 5353.70 |
| Annie Courtney | SDLP | 2560 | 882.00 | 3442.00 | 75.55 | 3517.55 | 243.40 | 3760.95 |
| Gearoid O Heara | SF | 2531 | 77.40 | 2608.40 | 29.70 | 2638.10 | 16.80 | 2654.90 |
| Lynn Fleming | SF | 1360 | 100.80 | 1460.80 | 57.75 | 1518.55 | 12.25 | 1530.80 |
| Colm Cavanagh | APNI | 1058 | 142.65 | 1200.65 | 146.70 | 1347.35 | -1347.35 | |
| Ken Adams | Labour | 345 | 58.95 | 403.95 | -403.95 | |
|
|
| Brian Gurney | PUP | 287 | 18.00 | 305.00 | -305.00 | |
|
|
| Peter MacKenzie | Green | 253 | 41.85 | 294.85 | -294.85 | |
|
|
| Donn Brennan | NLP | 32 | 4.50 | 36.50 | -36.50 | |
|
|
| |
|
|
|
|
|
|
|
|
| non-transferable | |
|
69.60 | 69.60 | 78.10 | 147.70 | 143.80 | 291.50 |
Stage 2: Of Hume's 12581 votes, 4400 went to Durkan, 3372 to Tierney and 1960 to Courtney, thus 9732 (77.35%) to the other SDLP candidates; 1170 went to McLaughlin, 285 to Nelis, 224 to Fleming and 172 to O hEara, thus 1851 (14.71%) to the SF candidates; 317 (2.52%) to Cavanagh (Alliance); 131 (1.04%) to Adams (Labour); 102 (0.81%) to Allen (UUP); 93 (0.74%) to MacKenzie (Green); 40 (0.32%) to Gurney (PUP); 36 (0.29%) to Hay (DUP) with 269 (2.14%) non-transferable.
| |
Stage 4 | Exclude Fleming | Exclude O hEara | Exclude Courtney | ||||
| John Hume | SDLP | 6971 | |
6971 | |
6971 | |
6971 |
| Mitchel McLaughlin | SF | 6007.90 | 1035.00 | 7042.90 | |
7042.90 | |
7042.90 |
| Mark Durkan | SDLP | 6812.90 | 60.75 | 6873.65 | 106.25 | 6979.90 | |
6979.90 |
| John Tierney | SDLP | 5457.20 | 37.40 | 5494.60 | 106.00 | 5600.60 | 2212.00 | 7812.60 |
| Mary Nelis | SF | 3659.35 | 178.95 | 3838.30 | 2371.90 | 6210.20 | 383.65 | 6593.85 |
| William Hay | DUP | 6293.80 | 2.00 | 6295.80 | 1.00 | 6296.80 | 18.45 | 6315.25 |
| Jack Allen | UUP | 5353.70 | 0.90 | 5354.60 | 1.00 | 5355.60 | 145.65 | 5501.25 |
| Annie Courtney | SDLP | 3760.95 | 52.35 | 3813.30 | 29.75 | 3843.05 | -3843.05 | |
| Gearoid O Heara | SF | 2654.90 | 78.65 | 2733.55 | -2733.55 | |
|
|
| Lynn Fleming | SF | 1530.80 | -1530.80 | |
|
|
|
|
| |
|
|
|
|
|
|
|
|
| non-transferable | |
291.50 | 84.80 | 376.30 | 117.65 | 493.95 | 1083.3 | 1577.25 |
| |
Stage 7 | Surplus Tierney | |
||
| John Hume | SDLP | 6971 | |
6971 | |
| Mitchel McLaughlin | SF | 7042.90 | |
7042.90 | |
| Mark Durkan | SDLP | 6979.90 | |
6979.90 | |
| John Tierney | SDLP | 7812.60 | -841.60 | 6971 | |
| Mary Nelis | SF | 6593.85 | 578.00 | 7171.85 | |
| William Hay | DUP | 6315.25 | 7.00 | 6322.25 | |
| Jack Allen | UUP | 5501.25 | 197.00 | 5698.25 | |
| |
|
|
|
|
|
| non-transferable | |
1577.25 | 59.60 | 1636.85 | |
Of the 2212 votes transferred to Tierney from Courtney, 578 (26.13%) went to Nelis, 197 (8.91%) to Allen, and 7 (0.32%) to Hay with 1430 (64.65%) non-transferable.
Jack Allen of the UUP had the fourth highest number of first preferences here, but was overtaken by the second and third SDLP runners, and by Sinn F�in's Mary Nelis. The final result was one of the least surprising in Northern Ireland, as the SDLP consolidated in one of their best constituencies.
Full 1998 results for each seat: East Belfast | North Belfast | South Belfast | West Belfast | East Antrim | North Antrim | South Antrim | North Down | South Down | Fermanagh and South Tyrone | Foyle | Lagan Valley | East Londonderry | Mid Ulster | Newry and Armagh | Strangford | West Tyrone | Upper Bann
Other sites based at ARK: ORB (Online Research Bank) | CAIN (Conflict Archive on the INternet) | Northern Ireland Life and Times Survey
Your comments, please! Send an email to me at nicholas.whyte@gmail.com..
Nicholas Whyte, 15 October 2000; modified 16 February 2002.
|
|
Disclaimer:�
Nicholas Whyte 1998-2004 Last Updated onSunday,
14-Mar-2010 17:50
|