
 |
 |
|
|
|
|
Monday March 31, 2025
|


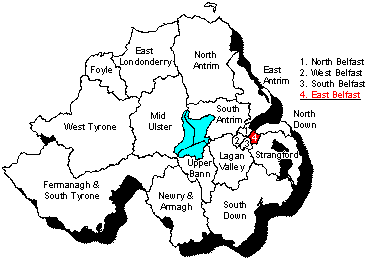
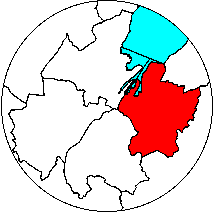
Maps by Conal Kelly and Nicholas Whyte
See also results of all East Belfast elections 1993-2010 and full counts from 2003 and 2007. Spreadsheet for 1998 here.
| |
Stage 1 | Surplus Robinson | Surplus Alderdice | Exclude Bell, Collins, Lawrence | ||||
| Peter Robinson | DUP | 11219 | -5562 | 5657 | |
5657 | |
5657 |
| Lord Alderdice | APNI | 6144 | |
6144 | -487 | 5657 | |
5657 |
| David Ervine | PUP | 5114 | 185.00 | 5299.00 | 39.13 | 5338.13 | 18.63 | 5356.76 |
| Reg Empey | UUP | 5158 | 130.00 | 5288.00 | 36.54 | 5324.54 | 3.28 | 5327.82 |
| Sammy Wilson | DUP | 633 | 3853.00 | 4486.00 | 1.68 | 4487.68 | |
4487.68 |
| Ian Adamson | UUP | 3447 | 63.00 | 3510.00 | 20.30 | 3530.30 | 4.00 | 3534.30 |
| Richard Good | APNI | 1000 | 9.50 | 1009.50 | 280.98 | 1290.48 | 18.70 | 1309.18 |
| Denny Vitty | UKUP | 1362 | 312.00 | 1674.00 | 1.05 | 1675.05 | |
1675.05 |
| Peter Jones | SDLP | 1025 | 1.50 | 1026.50 | 8.40 | 1034.90 | 20.14 | 1055.04 |
| Jim Rodgers | UUP | 1015 | 174.50 | 1189.50 | 5.04 | 1194.54 | 1.00 | 1195.54 |
| John Norris | DUP | 373 | 723.50 | 1096.50 | 0.63 | 1097.13 | 1.00 | 1098.13 |
| Joe O'Donnell | SF | 917 | |
917.00 | 1.19 | 918.19 | 11.21 | 929.40 |
| Pearl Sagar | NIWC | 711 | 12.00 | 723.00 | 11.83 | 734.83 | 13.14 | 747.97 |
| Robert Girvan | UDP | 516 | 49.50 | 565.50 | 1.54 | 567.04 | 1.00 | 568.04 |
| David Bleakley | Lab | 369 | 8.00 | 377.00 | 12.60 | 389.60 | 10.12 | 399.72 |
| Dawn Purvis | PUP | 271 | 15.50 | 286.50 | 0.91 | 287.41 | 2.07 | 289.48 |
| Lesley Donaldson | Con | 203 | 18.50 | 221.50 | 2.87 | 224.37 | 2.50 | 226.87 |
| Joe Bell | WP | 79 | 0.50 | 79.50 | 2.59 | 82.09 | -82.09 | |
| David Collins | NLP | 22 | |
22.00 | 0.49 | 22.49 | -22.49 | |
| John Lawrence | E106 | 15 | |
15.00 | 0.42 | 15.42 | -15.42 | |
| |
|
|
|
|
|
|
|
|
| non-transferable | |
|
6.00 | 6.00 | 58.81 | 64.81 | 13.21 | 78.02 |
Stage 2: Of Robinson's 11219 votes, 7706 transferred to Wilson and 1447 to Norris, thus 9153 (81.58%) to the other DUP candidates; 349 to Rodgers, 260 to Empey and 126 to Adamson, thus 735 (6.51%) to the UUP candidates; 624 (5.56%) to Vitty (UKUP); 370 to Ervine and 31 to Purvis, thus 401 (3.57%) to the PUP candidates; 99 (0.88%) to Girvan (UDP); 37 (0.33%) to Donaldson (Conservative); 24 (0.21%) to Sagar (NIWC); 19 (0.17%) to Good (Alliance); 16 (0.14%) to Bleakley (Labour); 3 (0.03%) to Jones (SDLP); 1 (0.01%) to Bell (WP); and none to O'Donnell (SF), Collins (NLP) or Lawrence (E106) with 107 (0.95%) non-transferable.
Stage 3: Of Alderdice's 6144 votes, 4014 (65.33%) transferred to Good (Alliance); 522 to Empey, 290 to Adamson and 72 to Rodgers, thus 884 (14.39%) to the UUP candidates; 559 to Ervine and 13 to Purvis, thus 572 (9.31%) to the PUP candidates; 180 (2.93%) to Bleakley (Lab); 169 (2.75%) to Sagar (NIWC); 120 (1.95%) to Jones (SDLP); 41 (0.67%) to Donaldson (Conservative); 37 (0.60%) to Bell (WP); 24 to Wilson and 9 to Norris, thus 33 (0.54%) to the DUP candidates; 22 (0.36%) to Girvan (UDP); 17 (0.28%) to O'Donnell (SF); 15 (0.24%) to Vitty (UKUP); 7 (0.11%) to Collins (NLP); and 6 (0.10%) to Lawrence (NLP) with 40 (0.65%) non-transferable.
| |
Stage 4 | Exclude Donaldson | Exclude Purvis | Exclude Bleakley | ||||
| Peter Robinson | DUP | 5657 | |
5657 | |
5657 | |
5657 |
| Lord Alderdice | APNI | 5657 | |
5657 | |
5657 | |
5657 |
| David Ervine | PUP | 5356.76 | 21.27 | 5378.03 | 221.42 | 5599.45 | 94.00 | 5693.45 |
| Reg Empey | UUP | 5327.82 | 41.56 | 5369.38 | 2.50 | 5371.88 | 50.02 | 5421.90 |
| Sammy Wilson | DUP | 4487.68 | 19.00 | 4506.68 | 13.07 | 4519.75 | 10.28 | 4530.03 |
| Ian Adamson | UUP | 3534.30 | 47.57 | 3581.87 | 4.07 | 3585.94 | 45.84 | 3631.78 |
| Richard Good | APNI | 1309.18 | 15.56 | 1324.74 | 6.35 | 1331.09 | 85.59 | 1416.68 |
| Denny Vitty | UKUP | 1675.05 | 29.00 | 1704.05 | 4.50 | 1708.55 | 14.35 | 1722.90 |
| Peter Jones | SDLP | 1055.04 | 0.14 | 1055.18 | 2.00 | 1057.18 | 9.35 | 1066.53 |
| Jim Rodgers | UUP | 1195.54 | 16.64 | 1212.18 | 9.00 | 1221.18 | 17.28 | 1238.46 |
| John Norris | DUP | 1098.13 | 5.00 | 1103.13 | 3.50 | 1106.63 | 4.14 | 1110.77 |
| Joe O'Donnell | SF | 929.40 | 0.07 | 929.47 | |
929.47 | 7.07 | 936.54 |
| Pearl Sagar | NIWC | 747.97 | 4.14 | 752.11 | 11.07 | 763.18 | 37.19 | 800.37 |
| Robert Girvan | UDP | 568.04 | 1.57 | 569.61 | 9.07 | 578.68 | 11.71 | 590.39 |
| David Bleakley | Lab | 399.72 | 8.57 | 408.29 | 1.00 | 409.29 | -409.29 | |
| Dawn Purvis | PUP | 289.48 | 0.07 | 289.55 | -289.55 | |
|
|
| Lesley Donaldson | Con | 226.87 | -226.87 | |
|
|
|
|
| |
|
|
|
|
|
|
|
|
| non-transferable | |
78.02 | 16.71 | 94.73 | 2.00 | 96.73 | 22.47 | 119.20 |
| |
Stage 7 | Exclude Girvan | Exclude Sagar | Exclude O'Donnell | ||||
| Peter Robinson | DUP | 5657 | |
5657 | |
5657 | |
5657 |
| Lord Alderdice | APNI | 5657 | |
5657 | |
5657 | |
5657 |
| David Ervine | PUP | 5693.45 | |
5693.45 | |
5693.45 | |
5693.45 |
| Reg Empey | UUP | 5421.90 | 75.50 | 5497.40 | 93.25 | 5590.65 | 2.00 | 5592.65 |
| Sammy Wilson | DUP | 4530.03 | 87.14 | 4617.17 | 20.57 | 4637.74 | 3.00 | 4640.74 |
| Ian Adamson | UUP | 3631.78 | 50.07 | 3681.85 | 64.84 | 3746.69 | 2.00 | 3748.69 |
| Richard Good | APNI | 1416.68 | 23.20 | 1439.88 | 316.80 | 1756.68 | 57.42 | 1814.10 |
| Denny Vitty | UKUP | 1722.90 | 33.00 | 1755.90 | 17.07 | 1772.97 | |
1772.97 |
| Peter Jones | SDLP | 1066.53 | 2.57 | 1069.10 | 156.1 | 1225.20 | 363.56 | 1588.76 |
| Jim Rodgers | UUP | 1238.46 | 46.92 | 1285.38 | 28.07 | 1313.45 | 2.07 | 1315.52 |
| John Norris | DUP | 1110.77 | 50.57 | 1161.34 | 10.07 | 1171.41 | 1.00 | 1172.41 |
| Joe O'Donnell | SF | 936.54 | 1.00 | 937.54 | 14.14 | 951.68 | -951.68 | |
| Pearl Sagar | NIWC | 800.37 | 21.64 | 822.01 | -822.01 | |
|
|
| Robert Girvan | UDP | 590.39 | -590.39 | |
|
|
|
|
| |
|
|
|
|
|
|
|
|
| non-transferable | |
119.20 | 198.78 | 317.98 | 101.10 | 419.08 | 520.63 | 939.71 |
| |
Stage 10 | Exclude Norris | Exclude Rodgers | Surplus Empey | ||||
| Peter Robinson | DUP | 5657 | |
5657 | |
5657 | |
5657 |
| Lord Alderdice | APNI | 5657 | |
5657 | |
5657 | |
5657 |
| David Ervine | PUP | 5693.45 | |
5693.45 | |
5693.45 | |
5693.45 |
| Reg Empey | UUP | 5592.65 | 33.14 | 5625.79 | 483.00 | 6108.79 | -451.79 | 5657 |
| Sammy Wilson | DUP | 4640.74 | 891.50 | 5532.24 | 179.00 | 5711.24 | |
5711.24 |
| Ian Adamson | UUP | 3748.69 | 25.71 | 3774.40 | 406.39 | 4180.79 | 387.00 | 4567.79 |
| Richard Good | APNI | 1814.10 | 10.21 | 1824.31 | 40.81 | 1865.12 | 23.00 | 1888.12 |
| Denny Vitty | UKUP | 1772.97 | 107.50 | 1880.47 | 119.85 | 2000.32 | 23.00 | 2023.32 |
| Peter Jones | SDLP | 1588.76 | 1.00 | 1589.76 | 3.50 | 1593.26 | 1.00 | 1594.26 |
| Jim Rodgers | UUP | 1315.52 | 33.64 | 1349.16 | -1349.16 | |
|
|
| John Norris | DUP | 1172.41 | -1172.41 | |
|
|
|
|
| |
|
|
|
|
|
|
|
|
| non-transferable | |
939.71 | 69.71 | 1009.42 | 116.61 | 1126.03 | 17.79 | 1143.82 |
| |
|
|
|
|
|
|
|
|
Stage 13: Of the 483 votes transferred to Empey from Rodgers, 387 (80.12%) went to Adamson (UUP); 23 (4.76%) to Good (Alliance); also 23 (4.76%) to Vitty (UKUP) and 1 (0.21%) to Jones (SDLP) with 49 (10.14%) non-transferable.
| |
Stage 13 | Exclude Jones | Exclude Vitty | ||||
| Peter Robinson | DUP | 5657 | |
5657 | |
5657 | |
| Lord Alderdice | APNI | 5657 | |
5657 | |
5657 | |
| David Ervine | PUP | 5693.45 | |
5693.45 | |
5693.45 | |
| Reg Empey | UUP | 5657 | |
5657 | |
5657 | |
| Sammy Wilson | DUP | 5711.24 | |
5711.24 | |
5711.24 | |
| Ian Adamson | UUP | 4567.79 | 68.05 | 4635.84 | 778.92 | 5414.76 | |
| Richard Good | APNI | 1888.12 | 976.21 | 2864.33 | 110.63 | 2974.96 | |
| Denny Vitty | UKUP | 2023.32 | 3.14 | 2026.46 | -2026.46 | |
|
| Peter Jones | SDLP | 1594.26 | -1594.26 | |
|
|
|
| |
|
|
|
|
|
|
|
| non-transferable | |
1143.82 | 546.86 | 1690.68 | 1136.91 | 2827.59 | |
Not a great surprise.
Full 1998 results for each seat: East Belfast | North Belfast | South Belfast | West Belfast | East Antrim | North Antrim | South Antrim | North Down | South Down | Fermanagh and South Tyrone | Foyle | Lagan Valley | East Londonderry | Mid Ulster | Newry and Armagh | Strangford | West Tyrone | Upper Bann
Other sites based at ARK: ORB (Online Research Bank) | CAIN (Conflict Archive on the INternet) | Northern Ireland Life and Times Survey
Your comments, please! Send an email to me at nicholas.whyte@gmail.com..
Nicholas Whyte, 15 October 2000; modified 16 February 2002.
|
|
Disclaimer:�
Nicholas Whyte 1998-2004 Last Updated onSunday,
14-Mar-2010 17:52
|