Who Won What When and Where?

Latest news: Individual constituencies and maps
have been updated for the 2024 Westminster election, and
there is a new page for the election as a whole.
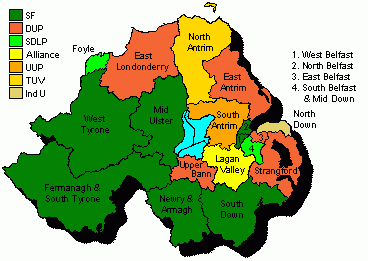
The map, and the links at the end of this paragraph, will
take you to a full set of election results since 1996 for
the 18 constituencies (ie electoral districts) used for
elections to the Northern Ireland Assembly and to the
House of Commons at Westminster. The current boundaries were first used for
the Westminster election of 2010.
The 18 constituencies are East Belfast,
North Belfast, South
Belfast, West Belfast, East Antrim, North
Antrim, South Antrim, North Down, South
Down, Fermanagh and South Tyrone,
Foyle, Lagan
Valley, East Londonderry, Mid Ulster, Newry
and
Armagh, Strangford, West Tyrone, and Upper
Bann. (See the map to the right, drawn by Conal
Kelly.)
Thanks to the generosity of the McDougall Trust, and
the
support
of the Centre
for Data Digitisation and Analysis at QUB, the
Northern Ireland Elections site is now able to offer Excel spreadsheets covering every
count of every full election in Northern Ireland since
1973.
On this site you will find information about elections in Northern Ireland since
1885, with particular information about the
elections held in 2024 (Westminster), 2022 (Assembly), 2019
(Westminster), 2019 (European
Parliament), 2019 (local
government), 2017 (Westminster),
2017 (Assembly), 2016 (Assembly), 2015
(Westminster), 2014 (European
Parliament), 2014 (local
government), 2011
(Assembly), 2011 (local
government), 2010 (Westminster),
2009 (European Parliament), 2007 (Assembly), 2005
(Westminster), 2005 (local
government), 2004 (European
Parliament), 2003 (Assembly),
2001 (Westminster), 2001 (local government), 2000 (South Antrim by-election), 1999 (European Parliament), 1998 (Assembly), 1997 (local government), 1997 (Westminster), 1996 (Forum/talks), 1995 (North Down by-election), 1994 (European Parliament), 1993 (local government), 1992 (Westminster), 1989 (European Parliament), 1989 (local government), 1987 (Westminster), 1986 (15 by-elections), 1985 (local government), 1984 (European Parliament), 1983 (Westminster), 1982 (Assembly), 1981 (local government), 1979 (European Parliament), 1979 (Westminster), 1977 (local government), 1975 (Convention), October 1974 Westminster), February 1974 (Westminster), 1973 (Assembly), 1973 (local government), and the
Westminster elections of 1970, 1966, 1964,
1959, 1955,
1951, 1950,
1945, 1935,
1931, 1929,
1924, 1923
and 1922 with details also of the
referendums held in 2016, 2011, 1998
and the 1970s.
On the Site Map page
you will find links to more information, including
descriptions of the political
parties, some historical pieces, and my selection of
useful books and links.
2023 Local Government Election Results
Summary
2022 Assembly Election Results Summary
|
|
| |
DUP |
UUP |
Alliance |
Others |
SDLP |
Sinn Fein |
| Seats won (2022) |
25 |
9 |
17
|
4
|
8 |
27 |
| Vote share (2022) |
21.3% |
11.2% |
13.5% |
15.9% |
9.1% |
29.0% |
|
Seats won (2017)
|
238 |
10 |
8
|
5
|
12 |
27 |
| Vote share (2017) |
28.1% |
12.9% |
9.1% |
10.1% |
11.9% |
27.9% |
2019 Westminster Election Results Summary
| |
DUP |
UUP |
Alliance |
Others |
SDLP |
Sinn Fein |
| Seats won (2019) |
8 |
0
|
1
|
0 |
2
|
7
|
| Vote share (2019) |
30.6% |
11.7% |
16.8% |
3.6% |
14.9% |
22.8%
|
|
| Seats won (2017) |
10 |
0
|
0
|
1
|
0 |
7
|
| Vote share (2017) |
36.0% |
10.3% |
7.9% |
4.7% |
11.7% |
29.4%
|
2019 European Election Results Summary
|
|
| |
DUP |
UUP |
Alliance |
Others |
SDLP |
Sinn Fein |
| Seats won (2019) |
1 |
0
|
1
|
0 |
0 |
1 |
| Vote share (2019) |
21.8% |
9.3% |
18.5% |
14.5% |
13.0% |
22.2% |
|
| Seats won (2014) |
1 |
1 |
0 |
0 |
0 |
1 |
| Vote share (2014) |
20.9% |
13.3% |
7.1% |
15.1% |
13.0% |
25.5% |
This web-page
was first published on 3 June 1998
|


