
 |
 |
|
|
|
|
Sunday April 27, 2025
|

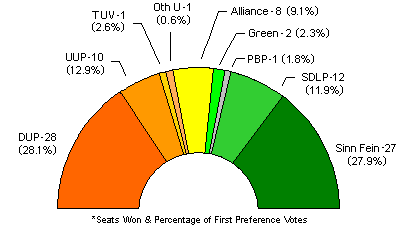
| Party / Candidate | 1st Pref Votes | 1st Pref % | (+/-) | Seats | (+/-) |
| Democratic Unionist Party | 225,413 | 28.1% | (-1.1%) | 28 seats | (-10) |
| Sinn Féin | 224,245 | 27.9% | (+3.9%) | 27 seats | (-1) |
| Ulster Unionist Party | 103,314 | 12.9% | (+0.3%) | 10 seats | (-6) |
| Social Democratic & Labour Party | 95,958 | 11.9% | (-0.1%) | 12 seats | - |
| Alliance Party | 72,717 | 9.1% | (+2.1%) | 8 seats | - |
| Traditional Unionist Voice | 20,523 | 2.6% | (-0.8%) | 1 seat | - |
| Green Party | 18,527 | 2.3% | (-0.4%) | 2 seats | - |
| People Before Profit Alliance | 14,100 | 1.8% | (-0.2%) | 1 seat | (-1) |
| Progressive Unionist Party | 5,590 | 0.7% | (-0.2%) | ||
| Claire Sugden (East Londonderry) | 4,918 | 0.6% | (+0.1%) | 1 seat | - |
| Conservatives | 2,399 | 0.5% | (+0.1%) | ||
| Cross-Community Labour Alternative | 2,009 | 0.5% | (+0.2%) | ||
| Jimmy Menagh (Strangford) | 1,627 | 0.2% | (+0.1%) | ||
| UK Independence Party | 1,579 | 0.2% | (-1.3%) | ||
| Jonathan Bell (Strangford) | 1,479 | 0.2% | |||
| Citizens Independent Social Thought Alliance | 1,273 | 0.3% | (-0.1%) | ||
| Workers Party | 1,261 | 0.3% | (+0.1%) | ||
| Melanie Kennedy (North Down) | 1,246 | 0.2% | |||
| Gerry Mullan (East Londonderry) | 1,204 | 0.1% | |||
| Sorcha McAnespy (West Tyrone) | 864 | 0.1% | - | ||
| Jonny Orr (Lagan Valley) | 856 | 0.2% | (+0.1%) | ||
| David McMaster (South Antrim) | 503 | 0.2% | |||
| Monica Digney (North Antrim) | 435 | 0.2% | |||
| Hugh McCloy (Mid Ulster) | 247 | 0.2% | |||
| Patrick Clarke (South Down) | 192 | 0.1% | |||
| Adam McBride (North Antrim) | 113 | 0.1% | |||
| Ricky Best (East Antrim) | 106 | 0.1% | |||
| Corey French (West Tyrone) | 98 | 0.1% | - | ||
| Chris Carter (North Down) | 92 | 0.1% | |||
| Roisin McMackin (West Tyrone) | 85 | 0.1% | |||
| Jordy McKeag (East Belfast) | 84 | 0.1% | |||
| Keith Gray (Lagan Valley) | 76 | 0.01% | |||
| Adam Millar (North Belfast) | 66 | 0.01% | |||
| Arthur McGuinness (Foyle) | 44 | 0.01% | |||
| Susan-Anne White (West Tyrone) | 41 | 0.01% | - | ||
| Gavan Reynolds (North Down) | 31 | 0.01% |
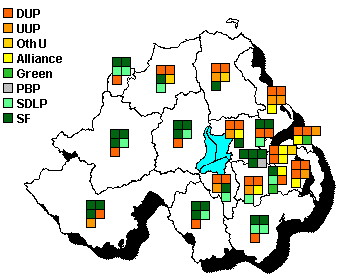
The image below shows the geographical distribution of seats won by each party in the election. It is worth noting that while the constituency boundaries did not change between this election and that of the 2016 Assembly election, the number of representatives returned by each constituency dropped from six to five. Despite this significant change, the results still provides a good opportunity for comparison and analysis. If and when the next Assembly election occurs, it is very likely that there will be considerable change to the existing boundaries. The Boundary Commission has begun it's sixth periodical review and is due to deliver it's final recommendations no later than 1 October 2018. Northern Ireland will see its number of constituencies decrease from 18 seats to 17. This will cause the number of MLAs elected to be reduced further from 90 to 85.

East Belfast 2 DUP, 2 Alliance, 1 UUP
North Belfast 2 SF, 2 DUP, 1 SDLP
South Belfast 1 SF, 1 SDLP, 1 Alliance, 1
DUP, 1 Green
West Belfast 4 SF, 1 PBP
East Antrim 2 DUP, 2 UUP, 1 Alliance
North Antrim 2 DUP, 1 TUV, 1 SF, 1 UUP
South Antrim 2 DUP, 1 UUP, 1 SF, 1 Alliance
North Down 2 DUP, 1 Alliance, 1 UUP, 1 Green
South Down 2 SF, 2 SDLP, 1 DUP
Fermanagh and South Tyrone 3 SF, 1 DUP, 1
UUP
Foyle 2 SF, 2 SDLP, 1 DUP
Lagan Valley 2 DUP, 1 UUP, 1 Alliance, 1
SDLP
East Londonderry 2 DUP, 1 SF, 1 Ind, 1 SDLP
Mid Ulster 3 SF, 1 DUP, 1 SDLP
Newry and Armagh 3 SF, 1 SDLP, 1 DUP
Strangford 3 DUP, 1 UUP, 1 Alliance
West Tyrone 3 SF, 1 DUP, 1 SDLP
Upper Bann 2 DUP, 1 UUP, 1 SF, 1 SDLP
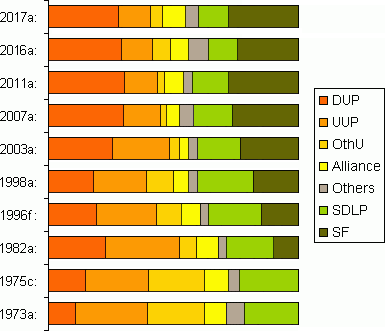
It was a terrible election for Unionists. Under the new rules, eighteen Stormont seats had been abolished, reducing the chamber from 108 to 90, five rather than six for each of the parliamentary constituencies. Of those eighteen seats, no less than sixteen were lost by Unionists (the other two had been held by Sinn Féin and the People Before Profit Alliance). This was not a result of any quirk in the electoral rules or boundaries; previous election results led most observers to expect that the inevitable pain from the reduction in numbers would be evenly shared by all sides. But that assumed that all sides’ vote share would stay the same, and it did not.
Unionists were reduced to one MLA out of the five representing each of South Belfast, South Down, Newry and Armagh, Mid Ulster and West Tyrone - all seats that actually elected Unionist MPs to Westminster in the not very distant past. The Ulster Unionist Party, which won all 40 of those Unionist seats in 1921, and was the largest party as recently as 2001, won only ten seats this year. The DUP lost ten seats of the 38 they had won in last year’s election. Northern Ireland’s political map has completely changed.
Turnout increased by almost 10 per cent over Northern Ireland as a whole, compared to the 2016 election. The biggest increases were precisely where Unionists suffered unexpected losses - Mid Ulster, South Down, East Londonderry. Nationalist vote share was up almost 4 per cent, Unionist vote share down by about 2 per cent (depending on how you count smaller groups). The non-sectarian Alliance Party increased its support by over 2 per cent, and they and the Green Party held all of their seats, despite the reduction in overall numbers. It’s pretty clear that non-Unionist voters came out in unprecedented numbers.

A remarkable feature of the election is that voters themselves seem more inclined to cross the divide. The SDLP’s vote share decreased yet again, giving them their worst result in history. But they managed to come out with no net losses. In several cases, seats that had appeared beyond their grasp in the early stages of counting fell into place thanks to transfers from the UUP - not just failure to transfer within Unionism, but an active choice by a crucial minority of moderate voters to try and block the extreme parties.
To be specific: UUP transfers were crucial for the SDLP seats in Lagan Valley and East Londonderry, and the SDLP returned the favour for the UUP in Fermanagh and South Tyrone. UUP leader Mike Nesbitt resigned on the evening of the count, regretting that he had not changed politics sufficiently, but his call for UUP voters to consider transferring to the SDLP ahead of the DUP may have been more effective than he gave himself credit for.
The closest results on the final count were:There was an unusually large number of close calls in earlier
counts in some constituencies,

Other sites based at ARK: ORB (Online Research Bank) | CAIN (Conflict Archive on the INternet) | Northern Ireland Life and Times Survey
Your comments, please! Send an email to me at nicholas.whyte@gmail.com.
Nicholas Whyte, 2 March 2017. Last updated by Conal Kelly, 25 May 2017.
|
|
Disclaimer:© Nicholas Whyte 1998-2004 Last
Updated onWednesday, 13-Apr-2022 17:52
|