
 |

|
|
|
|
|
Thursday April 3, 2025
|

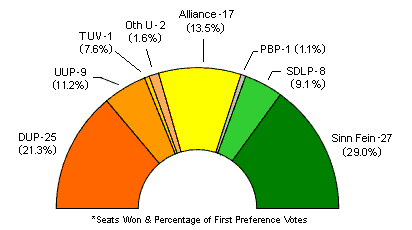
| Party / Candidate | 1st Pref Votes | 1st Pref % | (+/-) | Seats | (+/-) |
| Sinn F�in | 250,388 | 29.0% | (+1.1%) | 27 seats | - |
| Democratic Unionist Party | 184,002 | 21.3% | (-6.8%) | 25 seats | (-3) |
| Alliance Party | 116,681 | 13.5% | (+4.4%) | 17 seats | (+9) |
| Ulster Unionist Party | 96,390 | 11.2% | (-1.7%) | 9 seats | (-1) |
| Social Democratic & Labour Party | 78,237 | 9.1% | (-2.8%) | 8 seats | (-4) |
| Traditional Unionist Voice | 65,788 | 7.6% | (+5.0%) | 1 seat | - |
| Green Party | 16,433 | 1.9% | (-0.4%) | (-2) | |
| Aont� | 12,777 | 1.5% | (+1.5%) | - | |
| People Before Profit Alliance | 9,798 | 1.1% | (-0.7%) | 1 seat | - |
| Alex Easton (North Down) | 9,568 | 1.1% | (+0.2%) | 1 seat | (+1) |
| Claire Sugden (East Londonderry) | 3,981 | 0.5% | (-0.1%) | 1 seat | - |
| Gavin Malone (Newry & Armagh) | 3,157 | 0.4% | |||
| Progressive Unionist Party | 2,665 | 0.3% | (-0.4%) | ||
| Irish Republican Socialist Party | 1,869 | 0.2% | |||
| Paul Gallagher (West Tyrone) | 1,682 | 0.2% | |||
| Stephanie Quigley (East Londonderry) | 1,503 | 0.2% | |||
| Patrick Haughey (Mid Ulster) | 877 | 0.1% | |||
| Anne McCloskey (Foyle) | 854 | 0.1% | |||
| Workers Party | 839 | 0.1% | (-0.2%) | ||
| Gary Hynds (Lagan Valley) | 735 | 0.1% | |||
| Cross-Community Labour Alternative | 602 | 0.1% | (-0.4%) | ||
| Ray McKimm (North Down) | 604 | 0.1% | |||
| Socialist Party | 524 | 0.1% | |||
| Stafford Ward (Belfast North) | 489 | 0.1% | |||
| Andrew Moran (South Antrim) | 262 | 0.03% | |||
| Conservatives | 254 | 0.03% | - | ||
| Emma DeSouza (Fermanagh & South Tyrone) | 249 | 0.03% | |||
| Gerard Burns (Belfast West) | 192 | 0.02% | |||
| Niall Murphy (East Londonderry) | 181 | 0.02% | |||
| Patrick Clarke (South Down) | 134 | 0.02% | - | ||
| Tony Mallon (Belfast West) | 129 | 0.01% | |||
| Heritage | 128 | 0.01% | |||
| Derek Backhouse (Fermanagh & South Tyrone) | 128 | 0.01% | |||
| Barry Brown (West Tyrone) | 119 | 0.01% | |||
| Ben King (Strangford) | 118 | 0.01% | |||
| Elly Odhiambo (Belfast South) | 107 | 0.01% | |||
| Billy Stewart (East Londonderry) | 82 | 0.01% | |||
| Chris Carter (North Down) | 72 | 0.01% | |||
| Laird Shingleton (North Antrim) | 66 | 0.01% | |||
| Declan Hill (Belfast West) | 26 | 0.003% | |||
| Resume | 13 | 0.002% |
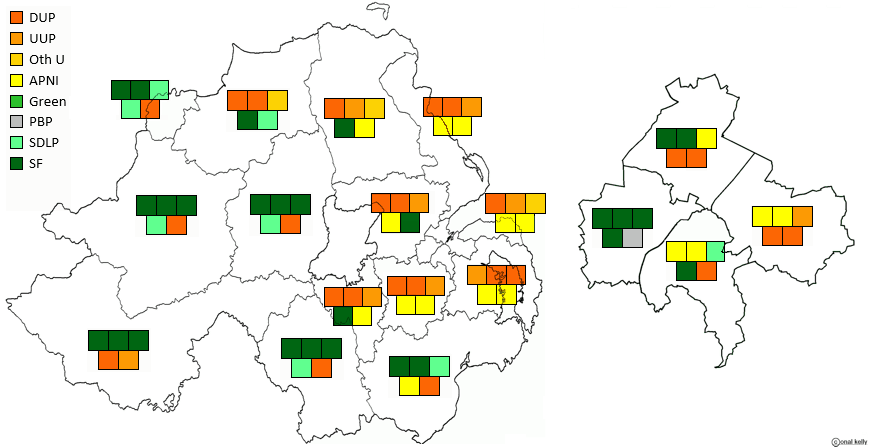
The first image below shows the geographical distribution of seats won
by each party in the election. It is worth noting that the constituency
boundaries did not change between this election and the 2017 Assembly
election, providing a good opportunity for comparison and analysis. If and
when the next Assembly election occurs, it is very likely that there will
be considerable change to the existing boundaries. The Boundary Commission
has begun its seventh periodical review and is due to deliver its final
recommendations no later than 1 July 2023.
The graphical representation below shows the geographical distribution of
seats by party in the election.
 |
Map by Conal Kelly
East Belfast 2 Alliance, 2 DUP, 1 UUP
North Belfast 2 SF, 2 DUP, 1 Alliance
South Belfast 2 Alliance, 1 SF, 1 SDLP, 1 DUP
West Belfast 4 SF, 1 PBP
East Antrim 2 DUP, 2 Alliance, 1 UUP
North Antrim 1 DUP, 1 TUV, 1 UUP, 1 SF, 1 Alliance
South Antrim 2 DUP, 1 SF, 1 UUP, 1 Alliance
North Down 2 Alliance, 1 Ind U, 1 DUP, 1 UUP
South Down 2 SF, 1 SDLP, 1 DUP, 1 Alliance
Fermanagh and South Tyrone 3 SF, 1 DUP, 1 UUP
Foyle 2 SF, 2 SDLP, 1 DUP
Lagan Valley 2 DUP, 2 Alliance, 1 UUP
East Londonderry 2 DUP, 1 SF, 1 Ind U, 1 SDLP
Mid Ulster 3 SF, 1 DUP, 1 SDLP
Newry and Armagh 3 SF, 1 DUP, 1 SDLP
Strangford 2 DUP, 2 Alliance, 1 UUP
West Tyrone 3 SF, 1 DUP, 1 SDLP
Upper Bann 2 DUP, 1 SF, 1 UUP, 1 Alliance
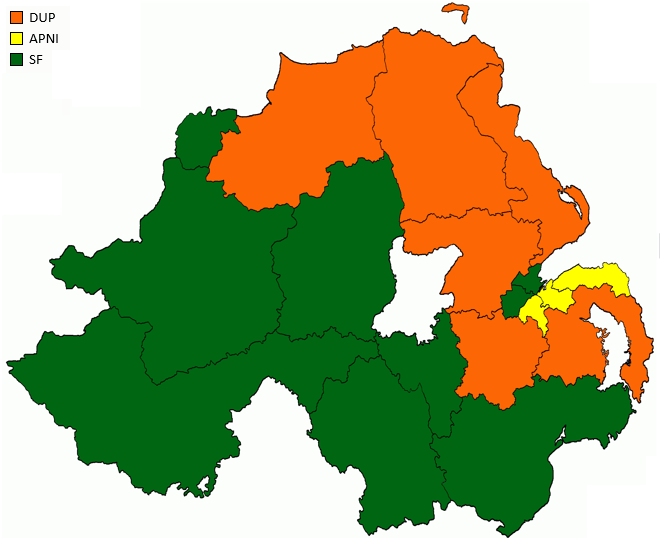
The map below shows the party with the largest first preference vote in each constituency. It is important to note that extrapolating first preferences in an PR-STV election to project winners in an FPTP election can be particularly challenging given the significant potential for tactical voting.

|
Map by Conal Kelly
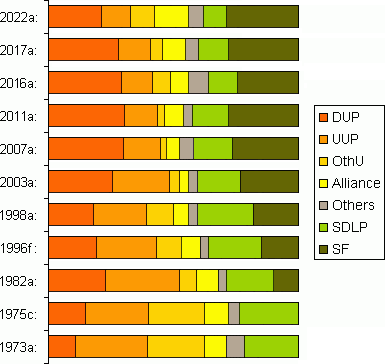
In summary it was a very good day for Alliance, good for SF, bad for SDLP, DUP, UUP and Greens. Calculating total vote tallies between the sides is complicated by minor parties and candidates, but the headline is that Unionists and Nationalists are not far apart. I had previously said that if Nationalists outnumber Unionists at a Stormont election, there are grounds for the Secretary of State to call a border poll. That threshold is not clearly met in terms of votes, and clearly not met in terms of seats won.
Ten seats changed hands in the election. Alliance gained nine - four from the SDLP, two each from the DUP and Greens and one from the UUP; and the DUP lost another seat in North Down where a former party colleague retained his seat as an independent.
SF did not gain or lose any seats, but became the largest party as the DUP tally fell. They missed out on two potential gains by poor balancing of their candidates, in East Londonderry and Upper Bann, and the UUP might also have had a chance of retaining both seats in East Antrim with better balancing.
The closest result was in Foyle, where the DUP survived a UUP challenge by 95 votes. That's on the final count; the closest decisive elimination was in East Londonderry, where Alliance candidate was eliminated 15 votes behind the SDLP and his transfers then elected her.
For the TUV to get only one seat despite vote share of
7.6% is remarkable - proportionally that should have given them at least
six! But they had great difficulty in attracting transfers. Conversely
the DUP's total of 25, while disappointing for the party, is about six
more than would be proportionally expected from a 21.3% vote share.
The turnout of 63.6% was down slightly (-1.2%) compared to 2017 but was
still the third highest since the Assembly was established in 1998.


Other sites based at ARK: ORB (Online Research Bank) | CAIN (Conflict Archive on the INternet) | Northern Ireland Life and Times Survey
Your comments, please! Send an email to me at nicholas.whyte@gmail.com.
Last updated by Conal Kelly, 7 May 2022.
|
|
Disclaimer:� Nicholas
Whyte 1998-2004 Last Updated on
Sunday, 06-Mar-2011 19:41
|