

 |
 |
|
|
|
|
Sunday April 6, 2025
|
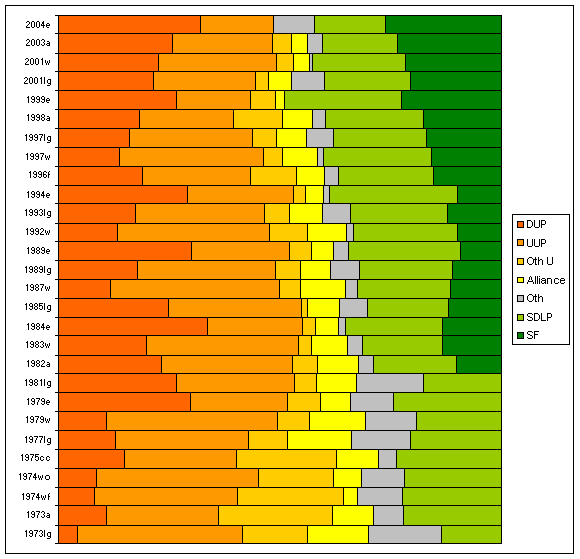
This graph
shows the results of all elections held across the whole of
Northern Ireland since 1973.
The five main political parties are:
The main political parties in Northern Ireland are:
Democratic Unionist Party (DUP)
Now the largest Unionist party, founded in 1970 by Rev Ian Paisley and led since 2008 by Peter Robinson, First Minister of Northern Ireland. The largest party opposed to the Agreement. Topped the poll at all European elections except 2009, and gained most votes in 2011 Assembly and local government elections. Recent election results range from 18% to 34%. Web-site at http://www.dup.org.uk/.Sinn F�in (SF)
Since 2001 the larger Nationalist party, led since 1983 by Gerry Adams. Largest single party in 2009 European and 2010 Westminster elections. Recent election results range from 23% to 26%. Web-site at http://sinnfein.ie/.Ulster Unionist Party (UUP)
Until 2003 the largest Unionist party, led since 2012 by Mike Nesbitt. Recent election results range from 13% to 18%. Web-site at http://www.uup.org/.Social Democratic and Labour Party (SDLP)
Before 2001, the largest Nationalist party, led since 2011 by Alasdair McDonnell. Recent election results range from 14% to 17%. Web-site at http://www.sdlp.ie/sdlp/.Alliance Party of Northern Ireland
Largest "cross-community" party in Northern Ireland. Led since October 2001 by David Ford MLA. Recent election results range from 4% to 8%. Web-site at http://www.allianceparty.org/.
I have had to group other parties and individuals together for reasons of space. Oth U includes Vanguard, various Loyalist groups and the pre-1974 anti-Faulkner Unionists, as well as the post-1974 Faulknerites, the Conservatives, Sir James Kilfedder, Robert McCartney and their followers; and Others includes both Bernadette McAliskey and the Northern Ireland Labour Party, who would have very little time for each other. (It is not always easy to separate Nationalists outside the two main parties from independents and genuine members of the centre ground. Look at, for instance, the careers of Gerry Fitt and the Workers Party.)
This variety among the Others partly explains what looks like a dramatic increase in the Nationalist vote share since 1973 in the above graph - in pre-1982 elections, independent Nationalist and Republican candidates were winning a significant share of the vote, almost all of which was absorbed by SF after 1982. There is also a genuine increase in the Nationalist vote over time, but the overall Nationalist/Unionist balance has moved less than the graph suggests.
It should also be noted that a change in legislation in 2001 made it much more difficult to describe yourself as an "Independent Unionist" for electoral purposes, so a number of Others from then on are actually misdescribed Unionists.
Elections to the 26 district councils are generally held on a four-yearly cycle. At present each council is divided into 3 to 5 District Electoral Areas (Belfast has 9) which return 5 to 7 councillors (until 1985 there was greater variation in the number and size of districts) by proportional representation, using the Single Transferable Vote. (Local elections in the rest of the UK are in single-member constituencies, but in Northern Ireland a proportional system has been used since 1973.) The lastlocal government elections were held in May 2011, two years late.
Other relevant information on this site includes pages on the local government elections of 2011, 2005, 2001, 1997, 1993, 1989, 1985, 1981, 1977, and 1973.
DUP UUP Oth U | Alliance | Others | SDLP SF ---------------------------+-----------+---------+----------- 2011 27% 15% 3% | 7% | 7% | 15% 25% cllrs: 175 99 9 | 44 | 30 | 87 138 ---------------------------+-----------+---------+-----------2005 30% 18% 2% | 5% | 5% | 17% 23% cllrs: 182 115 3 | 30 | 41 | 101 126 ---------------------------+-----------+---------+-----------2001 21% 23% 3% | 5% | 7% | 19% 21% cllrs: 131 154 8 | 28 | 36 | 117 108 ---------------------------+-----------+---------+----------- 1997 16% 28% 5% | 7% | 7% | 21% 17% cllrs: 91 185 33 | 41 | 38 | 120 74 ---------------------------+-----------+---------+----------- 1993 17% 29% 4% | 8% | 7% | 22% 12% cllrs: 103 197 32 | 44 | 28 | 127 51 ---------------------------+-----------+---------+----------- 1989 18% 31% 6% | 7% | 6% | 21% 11% cllrs: 110 194 30 | 38 | 28 | 121 43 ---------------------------+-----------+---------+----------- 1985 24% 29% 3% | 7% | 6% | 18% 12% cllrs: 142 190 14 | 34 | 26 | 101 59 ---------------------------+-----------+---------+----------- 1981 27% 27% 5% | 9% | 15% | 18% cllrs: 142 152 22 | 38 | 69 | 103 ---------------------------+-----------+---------+----------- 1977 13% 30% 9% | 14% | 13% | 21% cllrs: 74 178 34 | 70 | 57 | 113 ---------------------------+-----------+---------+----------- 1973 4% 41% 11% | 14% | 16% | 13% cllrs: 21 233 53 | 63 | 73 | 83 ---------------------------+-----------+---------+-----------
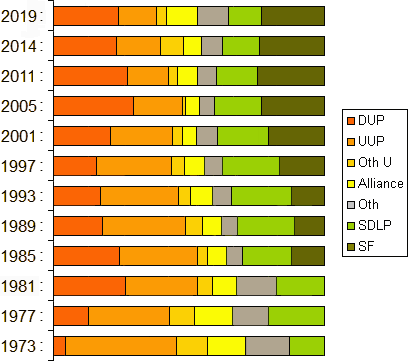
This graph shows the change in votes cast in local government elections since 1973. Note how after 1981 the vote for 'Others' sharply drops as SF enters the scene.
[contents]
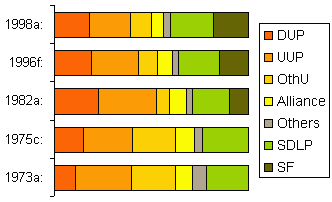
Since the old bicameral Parliament at Stormont was prorogued in 1972, there have been six elections to regional level bodies. The first three of these elections, in 1973, 1975 and 1982, were carried out by proportional representation using the then 12 Westminster constituencies, each electing between 4 and 10 members by the Single Transferable Vote. The 1996 elections used a completely different system - each of the 18 new Westminster constituencies elected five members from party lists by the d'Hondt formula, and the ten largest parties then got a bonus of two seats each, for a total of 110 seats. Finally, the 1998 and 2003 elections used the same 18 Westminster constituencies, but this time each electing six members by the Single Transferable Vote.
Although I have grouped these elections together, the bodies elected had very different powers, as follows:
This table does not include by-elections to the 1973-5 and 1982-6 Assemblies (1974: North Antrim; 1983: Armagh; 1984: South Belfast; 1985: South Down).
         DUP   UUP  Oth U  | Alliance  | Others  | SDLP  SF

---------------------------+-----------+---------+-----------

2011     30%   13%   4%    |    8%     |   3%    |  14%  27%

 seats:  38    16    2     |    8      |   1     |  14   29

---------------------------+-----------+---------+-----------

2007     30%   15%   4%    |    5%     |   3%    |  15%  26%

 seats:  36    18    1     |    7      |   2     |  16   28

---------------------------+-----------+---------+-----------

2003     26%   23%   4%    |    4%     |   3%    |  17%  24%

 seats:  30    27    2     |    6      |   1     |  18   24

---------------------------+-----------+---------+-----------

1998     18%   21%  11%    |    6%     |   3%    |  22%  18%

 seats:  20    28   10     |    6      |   2     |  24   18

---------------------------+-----------+---------+-----------

         DUP   UUP  Oth U  | Alliance  | Others  | SDLP  SF

---------------------------+-----------+---------+-----------

1996     19%   24%  10%    |    7%     |   3%    |  21%  15%

 seats:  24    30    7     |    7      |   4     |  21   17

---------------------------+-----------+---------+-----------

         DUP   UUP  Oth U  | Alliance  | Others  | SDLP  SF

---------------------------+-----------+---------+-----------

1982     23%   30%   6%    |    9%     |   3%    |  19%  10%

 seats:  21    26    2     |   10      |   0     |  14    5

---------------------------+-----------+---------+-----------

1975     15%   26%  22%    |   10%     |   4%    |  24%

 seats:  12    19   21     |    8      |   1     |  17

---------------------------+-----------+---------+-----------

1973     11%   29%  22%    |    9%     |   7%    |  22%

 seats:   8    24   18     |    8      |   1     |  19

---------------------------+-----------+---------+-----------
[contents]
Northern
Ireland had had twelve MPs at Westminster since the Queen's
University seat was abolished in 1948. In 1983 Northern
Ireland's representation was increased to 17, and in 1997 to 18
MPs. (See the history of Westminster
elections in Northern Ireland elsewhere on this site, and
individual constituency sites listed below.) Elections are by
the single-member constituency method.
The last Westminster elections took place in 2010;
previous ones covered on this site took place in 2005, 2001, 1997, 1992, 1987, 1983, 1979, October 1974
and February 1974. The next Westminster
elections are due in May 2015.
This table does not include by-elections (1981: Fermanagh and South Tyrone, twice; 1982: South Belfast; 1986: 15 constituencies; 1990: Upper Bann; 1995: North Down; 2000: South Antrim; 2011: West Belfast)
         DUP   UUP  Oth U  | Alliance  | Others  | SDLP  SF

---------------------------+-----------+---------+-----------

2011     25%   15%   10%   |    6%     |    1%   |  16%  26%

 MP's     8     0     1    |    1      |    0    |   3    5

---------------------------+-----------+---------+-----------

2005     34%   18%    0%   |    4%     |    2%   |  18%  24%

 MP's     9     1     0    |    0      |    0    |   3    5

---------------------------+-----------+---------+-----------

2001     22%   27%    4%   |    4%     |    1%   |  21%  22%

 MP's     5     6     0    |    0      |    0    |   3    4

---------------------------+-----------+---------+-----------

1997     14%   33%    4%   |    8%     |    1%   |  24%  16%

 MP's     2    10     1    |    0      |    0    |   3    2

---------------------------+-----------+---------+-----------

1992     13%   35%    8%   |    9%     |    2%   |  23%  10%

 MP's:    3     9     1    |    0      |    0    |   4    0

---------------------------+-----------+---------+-----------

1987     12%   38%    5%   |   10%     |    3%   |  21%  11%

 MP's:    3     9     1    |    0      |    0    |   3    1

---------------------------+-----------+---------+-----------

1983     20%   34%    3%   |    8%     |    4%   |  18%  13%

 MP's:    3    11     1    |    0      |    0    |   1    1

---------------------------+-----------+---------+-----------

1979     10%   37%   11%   |   12%     |   12%   |  18%

 MP's:    3     5     2    |    0      |    1    |   1

---------------------------+-----------+---------+-----------

1974o     8%   36%   17%   |    6%     |   10%   |  22%

 MP's:    1     6     3    |    0      |    1    |   1

---------------------------+-----------+---------+-----------

1974f     8%   32%   24%   |    3%     |   10%   |  22%

 MP's:    1     7     3    |    0      |    0    |   1

---------------------------+-----------+---------+-----------
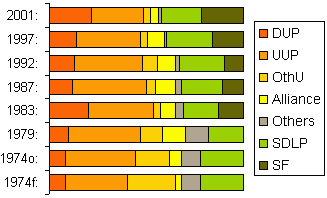
This graph shows the change in votes at Westminster elections in
Northern Ireland since 1974.
[contents]
Members of the
European Parliament
have been directly elected since 1979. The whole of Northern
Ireland forms a three-member constituency, and elections take
place every five years by proportional representation (using the
Single Transferable Vote) as for local
councils and regional elections.
The first five elections produced similar results, with the DUP
(Ian Paisley), SDLP (John Hume) and UUP (John Taylor, now Lord
Kilclooney, in 1979 and 1984, Jim Nicholson in 1989, 1994, and
1999) taking one seat each at every election. In 2004 Paisley
was replaced by Jim Allister for the DUP, and Hume also retired;
his seat was lost to Barbara de Brun of Sinn Fein. Allister left
the DUP before the 2009 election, and the seat
was retained for the party by Diane Dodds.
See the details for 2009, 2004, 1999, 1994, 1989, 1984, and 1979.
The next European elections are due to take place in May 2014.
         DUP   UUP  Oth U  | Alliance  | Others  | SDLP  SF

---------------------------+-----------+---------+-----------

2009     18%   17%  14%    |    6%     |   3%    |  16%  26%---------------------------+-----------+---------+-----------

2004     32%   17%   0%    |    0%     |   9%    |  16%  26%
---------------------------+-----------+---------+-----------

2004     32%   17%   0%    |    0%     |   9%    |  16%  26%

---------------------------+-----------+---------+-----------

1999     28%   18%   5%    |    2%     |   0%    |  28%  17%

---------------------------+-----------+---------+-----------

1994     29%   24%   2%    |    4%     |   3%    |  29%   9%

---------------------------+-----------+---------+-----------

1989     30%   22%   5%    |    5%     |   3%    |  25%   9%

---------------------------+-----------+---------+-----------

1984     34%   21%   3%    |    5%     |   2%    |  22%  13%

---------------------------+-----------+---------+-----------

1979     30%   22%   7%    |    7%     |   9%    |  25%

---------------------------+-----------+---------+-----------
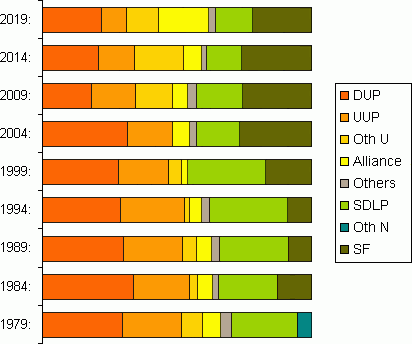
This graph
shows the change in votes in European elections since 1979. Note
that the yellow result bar for 2004 is that of independent
candidate John Gilliland, not the Alliance Party.
See also: The Boundary Commission's Provisional Recommendations | Boundary Commission 2003 | Jim Riley's analysis of votes and seats in the 1998 Assembly election | Gerrymandering | The constituencies | The political parties | The NI Executive | Useful books and links
Results from 1996 to 2001 for each seat: East Belfast | North Belfast | South Belfast | West Belfast | East Antrim | North Antrim | South Antrim | North Down | South Down | Fermanagh and South Tyrone | Foyle | Lagan Valley | East Londonderry | Mid Ulster | Newry and Armagh | Strangford | West Tyrone | Upper Bann
Other sites based at ARK: ORB (Online Research Bank) | CAIN (Conflict Archive on the INternet) | Northern Ireland Life and Times Survey
Front page | Site Map | Notes and Queries | Updates Mailing List | About this site
Your comments, please! Send an email to me at nicholas.whyte@gmail.com.
Nicholas Whyte, 16 August 1995; last modified 26 May 2013.
|
|
Disclaimer:� Nicholas Whyte 1998-2005 Last
Updated on
Tuesday, 05-May-2009
17:02
|