
 |

|
| |
| |
During a discussion of Irish election results in August 1999, cross-posted variously between ni.politics, uk.politics.electoral, and soc.culture.irish, both Jim Riley and I felt challenged to prove that to require a rigid ratio between electors and representatives is not a sufficient safeguard against gerrymandering .
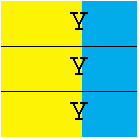
I started the bidding with the old chestnut about dividing the mythical county of Tymanagh with a population of 60% Yugoslavs and 40% Belgians into three single-seat constituencies. There are as it were 1.8 seats' worth of Yugoslavs, and 1.2 seats' worth of Belgians.
 |
A 'fair' result is clearly that the Yugoslavs should win two seats and the Belgians one; this picture illustrates just one possible arrangement that wold bring that about. |
 |
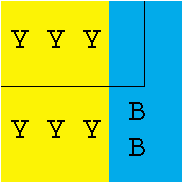
But since the Yugoslavs are a majority overall, it will usually be possible - in fact, it will usually be easier - to create three seats with Yugoslav majorities. |
 |
On the other hand, if the Yugoslavs are sufficiently geographically concentrated, this can be turned against them by creating a homogenous Yugoslav seat, leaving the Belgians a 60/40 advantage in the other two seats |
I concluded by stating that:
"Setting strong constraints on the size of electoral districts doesn't make gerrymandering very much more difficult at all. In fact if it's not compensated by other geographical constraints it can make it even easier to incorporate the next little village of Belgians just to make up the numbers."
Gerry Cunningham responded sceptically:
"Nice, if you're dealing with FPTP [ie first-past-the-post, UK or US-style]. Now let's see it with multi-seat STV."
So I came up with these two examples, illustrating how you could engineer different results where you had 80,000 voters, electing eight representatives by STV, and again 60% Yugoslavs (total of 48,000) and 40% Belgians (total of 32,000). Of course the "fair" result is that the Yugoslavs should win five seats and the Belgians three.
 |
But if the Belgians are drawing the boundaries,
you might find you have:
1) Tymanagh North-East, a 3-seat constituency, total electorate 30,000, 15,100 Belgians and 14,900 Yugoslavs. The quota is 7,500 so it elects 2 Belgians and 1 Yugoslav. 2) Tymanagh South-West, a 5-seat constituency, total population 50,000, 16,900 Belgians and 33,100 Yugoslavs. The quota is 8,334 so it elects 2 Belgians and 3 Yugoslavs. Total result: Belgians 4, Yugoslavs 4. |
 |
However if the Yugoslavs are in charge (which after all is more likely) you could get:
1) Tymanagh North-West, a 3-seat constituency, total population 30,000, 7,300 Belgians and 22,700 Yugoslavs. The quota is 7,500 so it elects no Belgians and 3 Yugoslavs. 2) Tymanagh South-East, a 5-seat constituency, total population 50,000, 24,700 Belgians and 25,300 Yugoslavs. The quota is 8,334 so it elects 2 Belgians and 3 Yugoslavs. Total result: Belgians 2, Yugoslavs 6. |
Jim Riley did it much more elegantly with some ascii maps which I have tuned into pretty colours here. He had 65% Yugoslav and 35% Belgians (to be more exact, 144 blocks of which 94 were Yugoslav and 50 Belgian), electing nine representatives by STV.
 |
Using 3-seaters we can have:
Tymanagh North (65%/35%), Tymanagh South (65%/35%), and Tymanagh Mid (67%/33%) each return 2 Yugoslavs and 1 Belgian. Totals - Yugoslavs 6, Belgians 3 - the "fair" result. |
 |
or:
Tymanagh West (100%/0%) returns 3 Yugoslavs, while Tymanagh North (48%/52%) and Tymanagh South (48%/52%) each return 1 Yugoslav and 2 Belgians. Totals - Yugoslavs 5, Belgians 4. |
 |
or switching to a 4-seater and a 5-seater:
Tymanagh West (81%/19%) returns 4 Yugoslavs, while Tymanagh East (53%/47%) returns 3 Yugoslavs and 2 Belgians. Totals - Yugoslavs 7, Belgians 2. |
All 3 of Jim's plans have an identical number of represented per representative in all districts. The districts are compact with regular boundaries. In fact, plans B and C, which produce the most deviation from the popular vote are more compact than plan A. (Thanks to Jim for letting me put his schemes on this site.)
Of course this is all a bit unrealistic in two respects. First, nowhere in the world insists on such a degree of accuracy in the ratio between representatives and population/electorate (and we'll just ignore that last distinction for now). Populations move all the time in the real world, and tolerances of 5% within a given region are usual; 10% is not unreasonable. The more members per constituency, the easier it is to make a difference. But second, which largely cancels out the first point, with margins as tight as these, the gerrymanders are very vulnerable to differential turnout and even more so to people of one tribe voting for candidates from another, or failing to transfer their votes down the line.
It is intrinsically more difficult to gerrymander proportional systems to get the result you want. Usually all you can hope to affect is where the 'last seat' in each constituency goes. The problem with any single-seat system is that every seat is the last seat in that constituency!
See also: The Boundary Commission's Provisional Recommendations | Boundary Commission 2003 | Jim Riley's analysis of votes and seats in the 1998 Assembly election | The constituencies | The political parties | Useful books and links
Results from 1996 to 2001 for each seat: East Belfast | North Belfast | South Belfast | West Belfast | East Antrim | North Antrim | South Antrim | North Down | South Down | Fermanagh and South Tyrone | Foyle | Lagan Valley | East Londonderry | Mid Ulster | Newry and Armagh | Strangford | West Tyrone | Upper Bann
Surveys of each recent election: 2004 European | 2003 Assembly | 2001 Westminster | 2001 local govt | 2000 S Antrim | 1999 European | 1998 Assembly | 1997 local govt | 1997 Westminster | 1996 Forum | 1995 N Down | 1994 European | 1993 local govt | 1992 Westminster | 1989 European | 1989 local govt | 1987 Westminster | 1986 by-elections | 1985 local govt | 1984 European | 1983 Westminster | 1982 Assembly | 1981 local govt | 1979 European | 1979 Westminster | 1977 local govt | 1975 Convention | Oct 1974 Westminster | Feb 1974 Westminster | 1973 Assembly | 1973 local govt | Summary of all Northern Ireland elections since 1973 | Brief summary of election results 1997-2003
Historical pieces: Westminster elections 1885-1910 | The 1918 election | Dáil elections since 1918 | Westminster elections since 1920 | Senate of Southern Ireland 1921 | Irish Senate elections in 1925 | Northern Ireland House of Commons | Northern Ireland Senate | The 1973 and 1975 referendums
Other sites based at ARK: ORB (Online Research Bank) | CAIN (Conflict Archive on the INternet) | Northern Ireland Life and Times Survey
Front page | Site Map | Notes and Queries | Updates Mailing List | About this site
Your comments, please! Send an email to me at nicholas.whyte@gmail.com.
Nicholas Whyte with input from Jim Riley, 4 September 1999; last modified 3 October 2000
|
Disclaimer:©
Nicholas Whyte 1998-2004 Last Updated on Wednesday, 12-Jan-2005 12:12
|