
 |

|
| |
| |
| Party | 2005
Westminster |
2005
local govt |
2004
European |
2003
Assembly |
2001
Westminster |
2001
local govt |
1999
European |
1998
Assembly |
| DUP | 34%
(9 MPs) |
30%
(182 cllrs) |
32%
(1 MEP) |
26%
(30 MLAs) |
22%
(5 MPs) |
21%
(131 cllrs) |
28%
(1 MEP) |
18%
(20 MLAs) |
| Sinn Féin | 24%
(5 MPs) |
23%
(126 cllrs) |
26%
(1 MEP) |
24%
(24 MLAs) |
22%
(4 MPs) |
21%
(108 cllrs) |
17% | 18%
(18 MLAs) |
| UUP | 18%
(1 MP) |
18%
(115 cllrs) |
17%
(1 MEP) |
23%
(27 MLAs) |
27%
(6 MPs) |
23%
(154 cllrs) |
18%
(1 MEP) |
21%
(28 MLAs) |
| SDLP | 18%
(3 MPs) |
17%
(101 cllrs) |
16% | 17%
(18 MLAs) |
21%
(3 MPs) |
19%
(117 cllrs) |
28%
(1 MEP) |
22%
(24 MLAs) |
| Alliance | 4% | 5%
(30 cllrs) |
[7%]* | 4% (6 MLAs) |
4% | 5%
(28 cllrs) |
2% | 6%
(6 MLAs) |
| Greens | 1%
(3 cllrs) |
1% | 0.4% | ** | 0.1% | |||
| PUP | 1%
(2 cllrs) |
1%
(1 MLA) |
1% | 2%
(4 cllrs) |
3% | 3%
(2 MLAs) |
||
| Con | 0.4% | 0.2% | * | 0.2% | 0.3% | 0.3% | 0.2% | |
| WP | 0.2% | 0.1% | * | 0.3% | 0.2% | 0.3% | 0.2% | |
| Socialist Environ- mental Alliance |
0.2% | 0.2% | 2% | 0.4% | ||||
| NIWC | 0.1% | 1% | 0.3% | 0.4%
(1 cllr) |
2%
(2 MLAs) |
|||
| UKUP | 0.1% | 1% (1 MLA) |
2% | 1%
(2 cllrs) |
3% | 5%
(5 MLAs) |
||
| Lab | * | ** | 0.3% | |||||
| Oth Un | 2% | 1% | 1%
(2 cllrs) |
0.3% (2 cllrs) |
4%
(3 MLAs) |
|||
| Others | 2% | 5%
(21 cllrs) |
2% (1 MLA) | 1% | 7%*
(35 cllrs) |
0.8% |
* An independent candidate in the 2004 European election gained 6.6% of the first preference votes. He was supported by Alliance, the Worlers Party, the Conservatives and some of the Labour groups.
** New legislation caught several parties on the hop in 2001. Labour and the Greens were not officially registered in time for the elections, so their members ran as independents in the local government elections (they had no Westminster candidates). No "Labour" candidates stood in the 2003 or 2005 elections.
The next elections in Northern Ireland may be Assembly elections, technically due in November 2007; or else a likely triple whammy of European, Westminster and local elections in 2009.

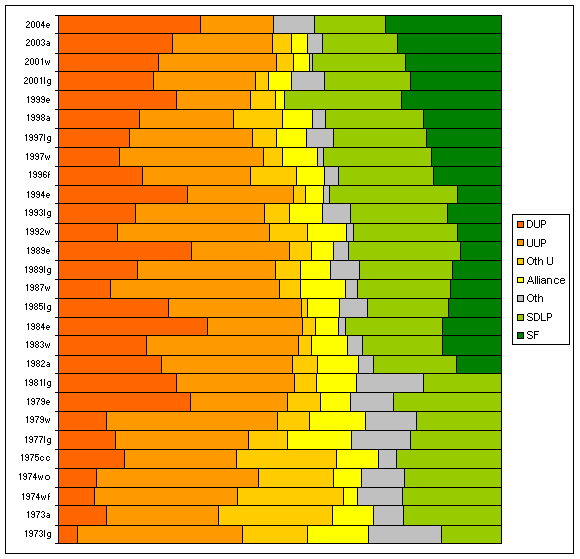
This graph summarises the results of elections in Northern Ireland from 1973.
See also:Boundary Commission 2003 | The constituencies | The political parties | Useful books and links
Results from 1996 to 2003 for each seat: East Belfast | North Belfast | South Belfast | West Belfast | East Antrim | North Antrim | South Antrim | North Down | South Down | Fermanagh and South Tyrone | Foyle | Lagan Valley | East Londonderry | Mid Ulster | Newry and Armagh | Strangford | West Tyrone | Upper Bann
Surveys of each recent election: 2004 European | 2003 Assembly | 2001 Westminster | 2001 local govt | 2000 S Antrim | 1999 European | 1998 Assembly | 1997 local govt | 1997 Westminster | 1996 Forum | 1995 N Down | 1994 European | 1993 local govt | 1992 Westminster | 1989 European | 1989 local govt | 1987 Westminster | 1986 by-elections | 1985 local govt | 1984 European | 1983 Westminster | 1982 Assembly | 1981 local govt | 1979 European | 1979 Westminster | 1977 local govt | 1975 Convention | Oct 1974 Westminster | Feb 1974 Westminster | 1973 Assembly | 1973 local govt | Summary of all Northern Ireland elections since 1973 | Brief summary of election results 1997-2003
Other sites based at ARK: ORB (Online Research Bank) | CAIN (Conflict Archive on the INternet) | Northern Ireland Life and Times Survey
Front page | Site Map | Notes and Queries | Updates Mailing List | About this site
Your comments, please! Send an email to me at nicholas.whyte@gmail.com.
Nicholas Whyte,
3 December 2000; last modified Monday, May 23, 2005 17:44:14.
|
Disclaimer:©
Nicholas Whyte 1998-2005 Last Updated on Monday, May 23, 2005 17:44:21
|