

| |
|
|
|
|
|
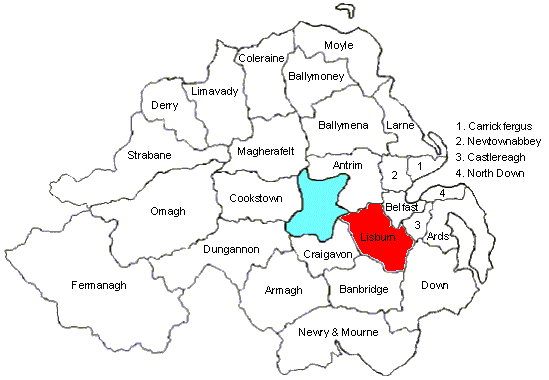
Map by Conal Kelly
| 1981 Results | 1977 Results | 1973 Results |
| Votes by Party: DUP: 13,867 (42.7%), 10 Councillors UUP: 10,471 (32.2%), 8 Councillors Alliance: 3,976 (12.2%), 2 Councillors SDLP: 1,918 (5.9%), 2 Councillors UUUP: 659 (2.0%), 1 Councillor WPRC: 462 (1.4%) UPNI: 232 (0.7%) NILP: 107 (0.3%) CPI: 72 (0.2%) Independent: 740 (2.3%) |
Votes by Party: UUP: 7,271 (28.7%), 8 Councillors DUP/UUUC: 6,724 (26.6%), 6 Councillors Alliance: 5,164 (20.4%), 3 Councillors UUUP/UUUC: 2,070 (8.2%), 2 Councillors SDLP: 1,563 (6.2%), 2 Councillors UPNI: 1,485 (5.9%), 1 Councillor VUP: 507 (2.0%) Republican Clubs: 305 (1.2%) Independent: 207 (0.8%) |
Votes by Party: UUP: 15,979 (48.9%), 14 Councillors Alliance: 5,916 (18.1%), 3 Councillors LDU: 5,482 (16.8%), 4 Councillors VUPP: 2,166 (6.6%), 1 Councillor SDLP: 1,721 (5.3%), 1 Councillor NILP: 749 (2.3%) Unofficial Unionist: 204 (0.6%) Independent: 445 (1.4%) |
| Electorate: 55,160; votes cast: 33,581; spoilt votes: 1,077 (3.2%); valid votes: 32,504 (96.8%) | Electorate: 52,197; votes cast: 26,266; spoilt votes: 970 (3.7%); valid votes: 25,296 (96.3%) | Electorate: 51.133; votes cast: 33,109; spoilt votes: 447 (1.4%); valid votes: 32,662 (98.6%) |
Lisburn A
1981 results (spreadsheet)
| First Count: R.D. Campbell (UUP) 1,299 J.H. Wels (DUP) 1,004 W.J. Dillon (UUP) 916 J.C. Clenaghan (SDLP) 905 C.J. Woodburne (DUP) 515 H. Stewart (UUP) 394 |
Votes by Party: DUP: 1,519 (30.2%), 1 seat UUP: 2,609 (51.8%), 2 seats SDLP: 905 (18.0%), 1 seat |
| Electorate: 7,983; seats: 4; votes cast: 5,142; spoilt votes: 109 (2.1%); valid votes: 5,033 (97.9%); quota: 1,007 |
1977 results (spreadsheet)
| First Count: R. Campbell (UUP) 889 C.J. Woodburne (DUP/UUUC) 695 J.C. Clenaghan (SDLP) 687 J. Dillon (UUP) 493 H. MCF. Stewart (UUP) 342 P. Dorrian (Alliance) 242 H. Sloan (UUUP/UUUC) 108 |
Votes by Party: DUP/UUUC: 695 (20.1%), 1 seat UUUP/UUUC: 108 (3.1%) UUP: 1,724 (50.4%), 2 seats Alliance: 242 (7.0%) SDLP: 687 (19.9%), 1 seat |
| Electorate: 6,981; seats: 4; votes cast: 3,630; spoilt votes: 174 (4.8%); valid votes: 3,456 (95.2%); quota: 692 |
1973 Results (spreadsheet)
| First Count: John Maze (UUP) 857 Patrick Ritchie (SDLP) 829 Charles Woodburn (LDU) 769 George McCartney (UUP) 747 Thomas Wilson (UUP) 535 William Moore (UUP) 313 Henry Stewart (Unof Un) 204 James Megarry (Alliance) 211 Patrick Dorrian (Alliance) 184 |
Votes by Party: Loyalist and Democratic Unionist: 769 (16.5%) Official Unionist: 2,452 (52.7%), 3 seats Unofficial Unionist: 204 (4.4%) Alliance: 395 (8.5%) SDLP: 829 (17.8%), 1 seat |
| Electorate: 7,210; seats: 4; votes cast: 4,707; spoilt votes: 58 (1.2%); valid votes: 4,649 (98.8%); quota: 930 |
Lisburn B
1981 Results (spreadsheet)
|
First
Count: |
Votes by Party: DUP: 2,558 (43.7%), 3 seats UUP: 2,324 (39.7%), 2 seats Alliance: 623 (10.6%) Independent: 351 (6.0%) |
| Electorate: 9,350; seats: 5; votes cast: 5,977; spoilt votes: 121 (2.0%); valid votes: 5,856 (98.0%); quota: 977 |
1977 results (spreadsheet)
| First Count: C. Poots (DUP/UUUC) 1,174 M.M. Sinnerton (Alliance) 656 W.G. Blakes (UUUP/UUUC) 606 Mrs Elsie Kelsey (UUP) 548 T.W. Lilburn (UUP) 523 J. Lilley (UUP) 334 S. Dorman (DUP/UUUC) 318 J. Curry (UUUP/UUUC) 181 |
Votes by Party: DUP/UUUC: 1,492 (34.4%), 2 seats UUUP/UUUC: 787 (18.1%), 1 seat UUP: 1,405 (32.4%), 2 seats Alliance: 656 (15.1%) |
| Electorate: 8,790; seats: 5; votes cast: 4,448; spoilt votes: 108 (2.4%); valid votes: 4,340 (97.6%); quota: 724 |
1973 results (spreadsheet)
| First Count: David Titterington (UUP) 1,102 Charles Poots (LDU) 1,089 Mrs E. Kelsey (UUP) 964 Ivan McKeever (UUP) 579 James Lilley (UUP) 551 Oliver Hunter (Alliance) 453 Robert Rush (VUPP) 303 David Williamson (VUPP) 258 Nancy McIntyre (Alliance) 157 Moore Sinnerton (Alliance) 139 |
Votes by Party: UUP: 3,196 (57.1%), 4 seats LDU: 1,089 (19.5%), 1 seat Alliance: 749 (13.4%) VUPP: 561 (10.0%) |
| Electorate: 9,328; seats: 5; votes cast: 5,682; spoilt votes: 87 (1.5%); valid votes: 5,595 (98.5%); quota: 933 |
Lisburn C
1981 results (spreadsheet - NB includes small correction to published result)
| First Count: W. Belshaw (DUP) 2,412 D. McCarroll (DUP) 856 W.G. Watson (UUP) 812 S.A. Close (Alliance) 811 W. McClung (UUP) 585 R. Dunsmore (DUP) 423 G. Morrison (UUUP) 401 W.J. Whitley (Ind) 389 R.J.H. Clarke (NILP) 107 |
Votes by Party: DUP: 3,691 (54.3%), 3 seats UUP: 1,397 (20.6%), 1 seat Alliance: 811 (11.9%), 1 seat UUUP: 401 (5.9%) Independent: 389 (5.7%) NILP: 107 (1.6%) |
| Electorate: 11,569; seats: 5; votes cast: 6,992; spoilt votes: 196 (2.8%); valid votes: 6,796 (97.2%); quota: 1,133 |
1977 results (spreadsheet)
| First Count: W. Belshaw (DUP/UUUC) 1,388 S.A. Close (Alliance) 987 W.G. Watson (UUP) 894 G. Morrison (UUUP/UUUC) 704 R. Crawford (VUP) 441 W. McClung (UUP) 397 D. MCCarroll (DUP/UUUC) 233 T. Hughes (Alliance) 188 |
Votes by Party: DUP/UUUC: 1,621 (31.0%), 1 seat UUP: 1,291 (24.7%), 2 seats Alliance: 1,175 (22.5%), 1 seat UUUP/UUUC: 704 (13.5%), 1 seat Vanguard Unionist Party: 441 (8.4%) |
| Electorate: 11,259; seats: 5; votes cast: 5,456; spoilt votes: 224 (4.1%); valid votes: 5,232 (95.9%); quota: 873 |
1973 results (spreadsheet)
| First Count: William Belshaw (LDU) 1,222 Norman Bicker (UUP) 929 James McKeown (UUP) 902 George Morrison (VUPP) 707 Seamus Close (Alliance) 604 William Watson (UUP) 538 Peter O'Hagan (SDLP) 457 Robert Allen (Ind) 445 William Matthews (UUP) 301 David Shanks (LDU) 289 Thomas Herron (VUPP) 271 A. Withby (NILP) 214 W. Ferris (Alliance) 185 W.G. Hammond (Alliance) 166 Harold McClure (UUP) 161 |
Votes by Party: UUP: 2,831 (38.3%), 2 seats LDU: 1,511 (20.4%), 1 seat VUPP: 978 (13.2%), 1 seat Alliance: 955 (12.9%), 1 seat SDLP: 457 (6.2%) NILP: 214 (2.9%) Independent: 445 (6.0%) |
| Electorate: 13,617; seats: 5; votes cast: 7,518; spoilt votes: 127 (1.7%); valid votes: 7,391 (98.3%); quota: 1,232 |
Lisburn D
1981 results (spreadsheet)
| First Count: I. Davis (DUP) 3,720 G.A. Boyd (Alliance) 1,086 S. Bemple(UUP) 1,069 Mrs M. McKinney (UUP) 788 J. Mulholland (Alliance) 479 R.J. McNiece (DUP) 470 D.W. Trimble (UUP) 454 D.R. Gordon (UPNI) 232 J. Curry (UUUP) 153 |
Votes by Party: DUP: 4,190 (49.6%), 2 seats UUP: 2,311 (27.3%), 2 seats Alliance: 1,565 (18.5%), 1 seat UPNI: 232 (2.7%) UUUP: 153 (1.8%) |
| Electorate: 14,016; seats: 5; votes cast: 8,639; spoilt votes: 188 (2.2%); valid votes: 8,451 (97.8%); quota: 1,409 |
1977 results (spreadsheet)
| First Count: I. Davis (DUP/UUUC) 1,758 J.W.C. Kirkwood (UPNI) 1,485 G.A. Boyd (Alliance) 1,218 S. Semple (UUP) 950 Mrs M. McKinney (UUP) 476 Mrs Hazel Devine (Alliance) 381 J.I. Davius (UUUP/UUUC) 282 G. King (Ind) 207 A.J. Oliver (VUP) 66 |
Votes by Party: DUPUUCC: 1,758 (25.8%), 1 seat Alliance: 1,599 (23.4%), 1 seat UPNI: 1,485 (21.8%), 1 seat UUP: 1,426 (20.9%), 2 seats UUUP/UUUC: 282 (4.1%)I ndependent: 207 (3.0%) Vanguard Unionist Party: 66 (1.0) |
| Electorate: 13,751; seats: 5; votes cast: 7,022; spoilt votes: 199 (2.8%); valid votes: 6.823 (97.2%); quota: 1,138 |
1973 results (spreadsheet)
| First Count: Samuel Semple (UUP) 2,294 G.W.C. McCartney (Alliance)1,424 Cecil Kirkwood (UUP) 1,126 Ivan Davis (LDU) 922 William Henry (UUP) 795 G.A. Boyd (Alliance) 603 J.I. Davis (VUPP) 485 P.J. Rowen (SDLP) 435 Hazel Ervine (Alliance) 300 Marjorie Lockhart (VUPP) 142 R.N. Hill (NILP) 116 James Hutchinson (UUP) 101 Myrtle McMaster (UUP) 90 |
Votes by Party: UUP: 4,406 (50.9%), 3 seats Alliance: 2,145 (24.8%), 1 seat LDU: 922 (10.7%), 1 seat VUPP: 627 (7.2%) SDLP: 435 (5.0%) NILP: 116 (1.3%) |
| Electorate: 10,564; seats: 5; votes cast: 8,723; spoilt votes: 72 (0.8%); valid votes: 8,651 (99.2%); quota: 1,442 |
Lisburn E
1981 results (spreadsheet)
| First Count: Rev. W.J. beattie (DUP) 1,909 W.J. McAllister (UUP) 1,830 W. McDonnell (SDLP) 1,013 J.E. Cousins (Alliance) 542 G. Dunlop (WPRC) 462 Fitzsimons (Alliance) 435 J.I. Davis (UUUP) 105 T. Bruton (CPI) 72 |
Votes by Party: DUP: 1,909 (30.0%), 1 seat UUP: 1,830 (28.7%), 1 seat SDLP: 1,013 (15.9%), 1 seat Alliance: 977 (15,3%) WPRC: 462 (7.3%) UUUP: 105 (1.6%), 1 seat CPI: 72 (1.1%) |
| Electorate: 12,242; seats: 4; votes cast: 6,831; spoilt votes: 463 (6.8%); valid votes: 6,368 (93.2%); quota: 1,274 |
1977 results (spreadsheet)
| First Count: J.E. Cousins (Alliance) 1,047 W.J. McAllister (UUP) 1,007 W. McDowell (SDLP) 876 Rev. W.J. Beattie (DUPUUC) 630 R.J. McNeice (DUP/UUUC) 528 B.A. Fitzsomons (Alliance) 445 D.S. Saulters (UUP) 418 G. Dunlop (Rep Cl) 305 Jean Bell (UUUP/UUUC) 189 |
Votes by Party: Alliance: 1,492 (27.4%), 1 seat UUP: 1,425 (26.2%), 1 seat DUP/UUUC: 1,158 (21.3%), 1 seat SDLP: 876 (16.1%), 1 seat Republican Clubs: 305 (5.6%) UUUP/UUUC: 189 (3.5%) |
| Electorate: 11,416; seats: 4; votes cast: 5,710; spoilt votes: 265 (4.6%); valid votes: 5,445 (95.4%); quota: 1,090 |
1973 results (spreadsheet)
| First Count: John Gilchrist (UUP) 1,479 John Cousins (Alliance) 1,172 Walter Groves (UUP) 872 Robert McNeice (LDU) 720 J.W. Patterson (Alliance) 500 Henry Winton (LDU) 471 Samuel Neill (UUP) 469 W.J.B. McIldoon (NILP) 419 Elizabeth Wright (UUP) 274 |
Votes by Party: UUP: 3,094 (48.5%), 2 seats Alliance: 1,672 (26.2%), 1 seat LDU: 1,191 (18.7%), 1 seat NILP: 419 (6.6%) |
| Electorate: 10,414; seats: 4; votes cast: 6,479; spoilt votes: 103 (1.6%); valid votes: 6,376 (98.4%); quota: 1,276 |
Local council election results from 1973 to 1983: Antrim | Ards | Armagh | Ballymena | Ballymoney | Banbridge | Belfast | Carrickfergus | Castlereagh | Coleraine | Cookstown | Craigavon | Derry | Down | Dungannon | Fermanagh | Larne | Limavady | Lisburn | Magherafelt | Moyle | Newry and Mourne | Newtownabbey | North Down | Omagh | Strabane
Local
council election results from 1985 to 1989: Antrim | Ards | Armagh
| Ballymena | Ballymoney | Banbridge | Belfast | Carrickfergus | Castlereagh | Coleraine | Cookstown | Craigavon | Derry | Down
| Dungannon | Fermanagh | Larne | Limavady | Lisburn | Magherafelt | Moyle | Newry and Mourne | Newtownabbey | North Down | Omagh | Strabane
Local council election results from 1993 to 2011: Antrim | Ards
| Armagh | Ballymena | Ballymoney | Banbridge | Belfast | Carrickfergus
| Castlereagh | Coleraine | Cookstown | Craigavon | Derry
| Down | Dungannon
| Fermanagh | Larne | Limavady
| Lisburn | Magherafelt | Moyle | Newry
and Mourne | Newtownabbey
| North Down | Omagh | Strabane
Results from 1983 to 1995 for each seat: East Belfast | North Belfast | South Belfast | West Belfast | East Antrim | North Antrim | South Antrim | North Down | South Down | Fermanagh and South Tyrone | Foyle | Lagan Valley | East Londonderry | Mid Ulster | Newry and Armagh | Strangford | Upper Bann
Other sites based at ARK: ORB (Online Research Bank) | CAIN (Conflict Archive on the INternet) | Northern Ireland Life and Times Survey
Your comments,
please! Send an email to me at nicholas.whyte@gmail.com.
 |
This page has been developed with the support of a project grant from the New Initiatives Fund of the Electoral Commission. However, any views expressed on this page or, in particular, other pages of this website are those of the author and not necessarily shared by The Electoral Commission. |
|
Disclaimer:© Nicholas Whyte 1998-2004 Last
Updated on
Wednesday, 12-Jan-2005
12:12
|